
“The four most dangerous words in investing are: ‘this time it’s different.’ “
- Sir John Templeton
“The stock market is a no-called-strike game. You don’t have to swing at everything--you can wait for your pitch. The problem when you’re a money manager is that your fans keep yelling, ‘Swing, you bum!’ “
- Warren Buffet
The “uh oh” moment. At first glance, it can take your breath away. It may even make your heart pound. If looked at long enough, it can even bring you to tears. And no, I’m not referring to Matthew McConaughey’s Oscar award-winning performance in Dallas Buyers Club. I’m talking about the point when you realize that you are paying a lot more than what you initially signed up for. Most readers at some time or another have likely made a purchase where the final price tag ends up being higher than originally anticipated. Often, this discrepancy is due to “one-time” charges, recurring expenses, or other stipulations buried in the fine print of a contract or agreement. And I am no exception to this age-old booby trap. In fact, my initial experience in this regard happened when I purchased my first home (actually a condo). About a year after I moved in, the homeowners association levied a “special assessment” for increased maintenance, and to build up its cash reserves. This turned out to be roughly 1.5% of the purchase price—not exactly the deal I thought I was getting into. Luckily, this was fairly minor compared to some HOA assessments that exceed 20% of the property’s value! As I recently told a friend, HOA should really stand for Hand Over Assessment.
But these transactional nightmares don’t stop with real estate purchases. I’ve heard several horror stories related to personal cell phone bills. There was an article written recently about subscribers whose monthly cellular bills exceeded $10,000 for not turning off their email’s auto-update function while traveling abroad. In Seattle, newspapers recently have highlighted citizens who’ve received astronomic toll bills for the city’s 520 bridge—the product of “billing errors.” Since starting its toll program in 2011, the state of Washington has levied more than $45 million in fines for people crossing the bridge. For many, they were unknowingly being charged late fees in the thousands of dollars for a variety of apparently unrelated reasons. Unfortunately, the majority of these commuters didn’t understand the fine print. By the time they did, it was too late— they were already buried under a landslide of fees.
So you’re probably wondering, what’s the point of this sermon on fine print? Well, we believe similarities can be drawn to the financial markets, both with stocks and bonds. For instance, did you know companies often incur one-time charges that are excluded from earnings? Or that earnings are often artificially boosted by companies taking on more debt to repurchase shares? Perhaps scariest of all, did you know the current return proposition for high-yield bonds doesn’t account for default rates returning to the norm? Overall, we are seeing a lot of complacency in the markets, and our team at Evergreen is more convinced than ever that there will soon be a resounding wake up call.
“One time!” This is a saying typically used when hoping for something extraordinary to happen. You might hear it yelled at your local YMCA basketball court or in a Vegas casino. For example, when you pull the lever on a slot machine with a million dollar jackpot, you’re just hoping that you can win this one time. Or when a golfer hits a tee shot on a par 3, they’re hoping against hope for that elusive hole-in-one just one time. The point is that if the jackpot or hole-in-one were to happen, it’s very unlikely to repeat—hence the exclamation of ‘one time.’
In the investment world, this phrase also exists in the form of one-time charges. Investopedia defines them as, “a charge against earnings that is expected to be an isolated one and not likely to occur again.” Some examples of these “anomalies” would be a bank paying a settlement for providing faulty mortgages during the financial crisis. A food manufacturer booking a loss for closing down a failed product would also qualify. Even a conglomerate writing off the premium it paid for an acquisition is considered a one-time charge. Since this loss is supposedly “non-recurring”, it’s not factored into earnings, making that figure look higher in the current period than the company’s actual bottom line. While somewhat anomalous, one-time items are actually quite important when analyzing a company. By omitting them, it effectively lowers a company’s price-to-earnings ratio, or said differently, reduces the earnings multiple you think you’re paying for a particular stock. Sites such as Bloomberg or Yahoo! Finance, do not take these into account when calculating the P/E ratio. As a result, the purchase price displayed is not accurately reflecting true company earnings (this discrepancy smacks of my initial HOA contract!).
So, how do these one-time charges affect the price we generally pay for stocks? The problem is that when you look at earnings for an index like the S&P 500, there are always several companies applying one-time adjustments. This effectively boosts the perceived earnings and, accordingly, the price you pay for them. In the chart below, you can see the difference between reported earnings (in green), and earnings that include one-time items (in blue). As you’ll notice, every year there is a significant disparity between actual earnings and earnings that exclude one-time items. In fact, since 1999 this number has averaged a staggering 20% per year. Even excluding pre-2009 data, which included the last two recessions, the number is still north of 10%. To paraphrase Milton Friedman, when it comes to corporate America’s accounting methodology, there’s nothing as recurring as nonrecurring charges!
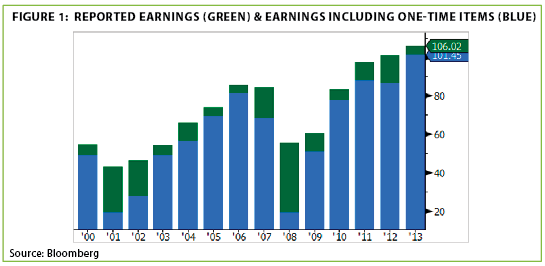
The gap between reported and actual earnings has certainly narrowed in recent years. This is because when the economy is doing well, and asset prices are rising, company write-downs (by definition) are less prevalent. On the flip side, when the well dries up, write-downs historically come gushing back as asset prices dip below their book value. Exacerbating the issue, regulatory changes in 2000 make it even easier for corporations to perform write-downs. Thus, when pressed on financial performance, corporations can simply book one-time items without negatively impacting “reported earnings.” During the next down phase, as in the previous two recessions, these items are very likely to come in bunches. All of these factors lead us to believe that there’s a hidden cost to stocks that buyers either do not understand, or are not factoring in to their typical valuations.
Seriously, try doing the opposite. For those who get paid to invest, buying high and selling low is a recipe for an abbreviated career. In the corporate finance community, though, this is simply the norm. While that sounds harsh, as you can see below, corporations have been horrible at timing stock buybacks. To reduce outstanding shares—and boost earnings per share— corporations often use cash on their balance sheet to buy back equity. This works quite well during rising markets, and helps earnings growth outpace the growth of the underlying business. However, it also can be a colossal waste of shareholder equity when poorly timed. And as you can see, in nearly perfect harmony, peaks of repurchases seem to very often coincide with market highs. Basically, corporations have been quite efficient at incinerating shareholder capital by buying their stock in bulk at the tail end of bull markets. Conversely, when valuations are actually attractive (see: 2009), and when stocks are at their lows, buybacks also bottom out—turning down a future ride on USS Moon Shot.
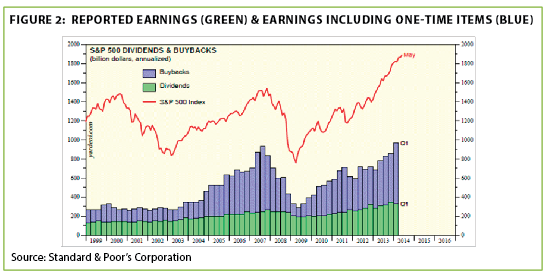
Today, with interest rates artificially low, corporations often buy back shares on the cheap by issuing debt. Using the proceeds of a bond issuance to buy back shares, these companies can essentially “grow” earnings via leverage. Does this strike you as a dangerous maneuver? It should. Especially since these major repurchases tend to mimic how individual investors are using leverage to buy securities like stocks. The graphic below shows how margin debt over the last 15 years has very closely tracked peaks in both share buybacks and the overall stock market.
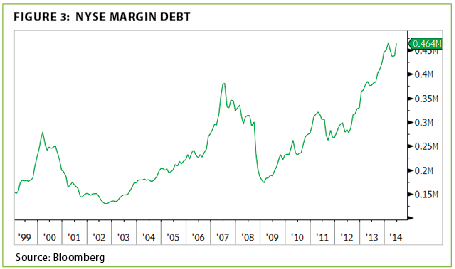
So let’s do a quick recap. Corporations have been taking on more debt in order to shrink equity through buybacks. At the same time, investors are using historically high amounts of leverage to buy those same stocks. To make matters worse, reported earnings are being artificially propped up and have shown significant volatility. Considering stocks are at their all-time highs, this situation appears to be nearing a tipping point. The writing is on the wall and the print is far from fine. Sadly for many investors, corporations have apparently mastered the art of making shareholder equity disappear, and we don’t think this time around will be any different.
Highway to the danger zone. Recent EVA editions have discussed high yield over-valuation, but I want to focus on a risk that’s largely being tossed aside: corporate defaults. In terms of default risk, we think that assuming the status quo will continue is a dangerous proposition. Still, there is a plausible explanation for this indifference since default rates have been suppressed now for several years. The chart below (courtesy of S&P) illustrates global default rates for investment-grade and high-yield bonds. As you can see, defaults have been extremely depressed since 2010:
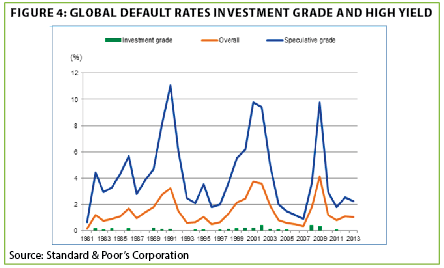
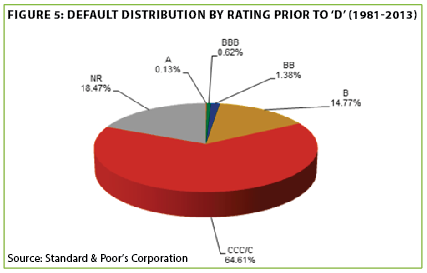
However, similar to our analysis of one-time items, you can see clear volatility with defaults. These tend to come in clusters and, as one would expect, occur in tandem with spikes of one-time items. Lower-rated corporations are the most exposed in this regard, with defaults regularly hitting 10% for sub-investment grade companies. Drilling down even further shows that over 85% of defaults have occurred in the junkiest part of the high-yield market (rated single-B and below). Our team at Evergreen views this area of the bond market as the most exposed, and overvalued, from a risk-adjusted return perspective.
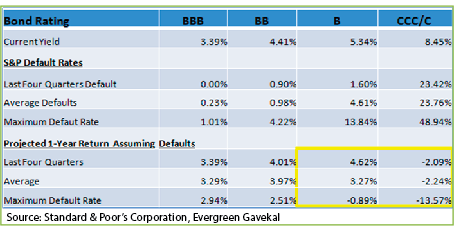
But we also wanted to take a look at historical default rates by bond rating. So, we ran a simple return projection assuming defaults either: 1) remain low (where they’ve been the last four quarters), 2) return to the long-run average, or 3) reach a worst-case maximum level. We then simulated a return projection under this default scenario with bondholders recovering the historical average of 55% of the original face value. Taking a look at the table below, the return proposition for bonds rated single-B and below is less than ideal.
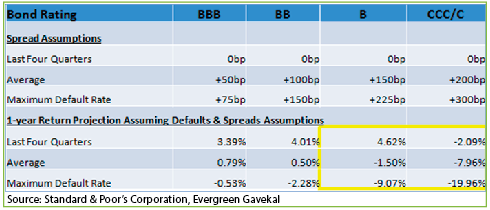
This analysis alone, however, doesn’t really do that slice justice. That’s because when defaults rise, the price investors are willing to pay for similar rated bonds fall. Or said differently, the yield required by investors increases with a higher probability of default. Since this concept can get murky, let’s use an analogy. Let’s say there’s a deadly virus with two vaccines. Vaccine A has a failure rate of 0% (success rate = 100%); Vaccine B has a failure rate of 25% (success rate = 75%). Most reasonably minded people would pay a premium price for Vaccine A. And if the failure rate for Vaccine B increased to 50%, the price you’d be willing to pay relative to Vaccine A would drop further. The same is true for bonds. As defaults rise, the price you are willing to pay—compared to AAA-rated bonds—falls in similar fashion to our vaccine example. So, we expanded our analysis further to assume credit spreads (the yield relative to high-grade bonds) increase as investors demand more compensation for the newfound increase in default probability (see table below).
In sum, assuming historical default accompanied by a spread-widening event, investors are accepting negative returns for the riskiest slice of bonds! And this assumes just a return to the norm. Similar to one-time items on the income statement, corporate bond defaults typically overshoot the average. With default rates being low for several years, history suggests we are due for at least a return to the mean, or even more likely, a return above the mean. For sure, there are many potential pitfalls when investing in “junky” bonds. But we think the amount of risk being taken for little to no return will leave many investors saying, “Oh, shoot”—or something a bit more colorful—and regretting their “dash to trash”.
Keep calm and ignore the music: Our overarching philosophy at Evergreen is to adhere to a contrarian investment strategy. We buy after periods of extreme weakness—usually a product of widespread write-down’s and defaults—when valuations and yields are depressed. Those who frequently read this publication also know we typically sell during times of excessive strength; generally a product of extreme investor optimism, excessive leverage, and rich valuations. Given today’s overcooked conditions, we think it’s prudent to analyze multiple scenarios using historical trends, not just skewed data from the last five Fed-fueled years.
Our team constantly analyzes the risk/reward landscape across the investment world. And when the risk outweighs the potential return, like in today’s junk bond space, we get out of the way. We believe this will add return over a full market cycle, while also minimizing portfolio risk. History and fine print have one big thing in common: if ignored, both can dole out major punishment. As the bubbly flows and music blares, we continue to look back at prior periods of giddiness with a careful eye for what could be looming when the party stops.

Important Disclosures
This report is for informational purposes only and does not constitute a solicitation or an offer to buy or sell any securities mentioned herein. This material has been prepared or is distributed solely for informational purposes only and is not a solicitation or an offer to buy any security or instrument or to participate in any trading strategy. All of the recommendations and assumptions included in this presentation are based upon current market conditions as of the date of this presentation and are subject to change. Past performance is no guarantee of future results. All investments involve risk including the loss of principal. All material presented is compiled from sources believed to be reliable, but accuracy cannot be guaranteed. Information contained in this report has been obtained from sources believed to be reliable, Evergreen Capital Management LLC makes no representation as to its accuracy or completeness, except with respect to the Disclosure Section of the report. Any opinions expressed herein reflect our judgment as of the date of the materials and are subject to change without notice. The securities discussed in this report may not be suitable for all investors and are not intended as recommendations of particular securities, financial instruments or strategies to particular clients. Investors must make their own investment decisions based on their financial situations and investment objectives.