
"A comfortable investor is a complacent investor, and a complacent investor is someone who is about to get his head handed to him."
-MICHAEL LEWITT, distressed debt expert and author of The Credit Strategist
POINTS TO PONDER
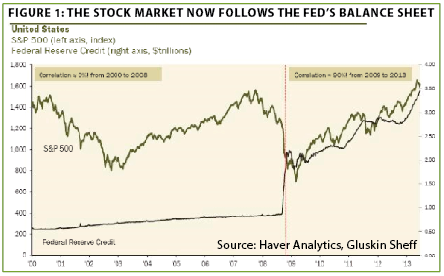
1. Stocks initially reacted euphorically when the Fed elected to maintain its trillion-dollar-per-year money creation extravaganza. After a one-day spurt, though, equities have come under pressure. Some of this weakness is almost certainly related to the latest congressional budget charades, but there also may be a growing realization that the days of a liquidity-driven market are coming to an end. (See Figure 1)
2. The Fed's flood of fabricated money has produced a perception of prosperity, at least among real estate and stock market investors. Unfortunately, however, the average American family now males less in CPI-adjusted terms than it did in 1988. Despite the nearly $3 trillion the Fed has conjured up, real household incomes have fallen for five consecutive years.
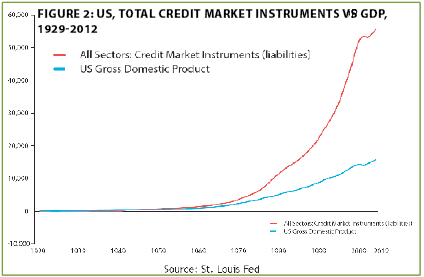
3. Trusty valuation measures like the cyclically adjusted P/E (CAPE; based on an average of the past 10 years' inflation-adjusted earnings) have provided few buy impulses over the last 20 years. During this time, the stock market has largely traded at higher P/E ratios, even adjusted for the profit cycle. It's possible this valuation inflation, well beyond anything seen in the prior hundred years, has been a function of the stunning growth in debt over the past two decades. (See Figure 2)
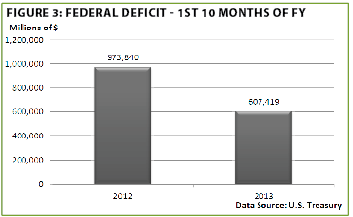
4. The bond market, unlike the stock market, has been terrified by rumblings of an end to the Fed’s large-scale asset purchases (LSAPs), otherwise known as QE (quantitative easing). Yet, one fortuitous offset to its eventual tapering is the $360 billion drop in the US government’s financing needs due to a narrowing deficit. (See Figure 3)
5. One somewhat below the radar but very positive trend in the US is the pronounced slowdown in medical inflation. Over the prior 90 days, the CPI for healthcare expenditures has risen by a mere 2.1% year-over-year. This is the smallest rate of increase in more than 40 years and likely reflects the growing number of healthcare plans giving consumers more control over (and responsibility for) outlays.
6. Smart technology is not just in your mobile phone and new car; it is also becoming pervasive in the world of agriculture. For example, John Deere’s 8000 series tractors have more computing power than the original space shuttle.
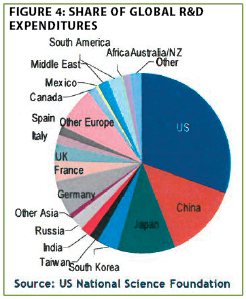
7. One reason the US is likely to remain the world’s most dynamic economy is that it spends more on research and development than China, Japan, South Korea, and Taiwan combined, as well as more than all of Europe. (See Figure 4)
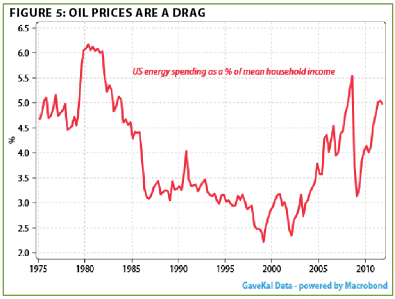
8. The US is expected to prop up global growth given dislocations in emerging markets, including China, and a still growth-challenged Europe. Yet, US consumer spending makes up 70% of GDP and high oil prices (though easing a bit) are a serious drain on household income, already crimped by years of flat real wage growth. (See Figure 5)
9. In another sign the US economy is still less than vigorous, retail sales have recently been disappointing. Additionally, industry forecasters are predicting the worst holiday shopping season since the deep recession year of 2009.
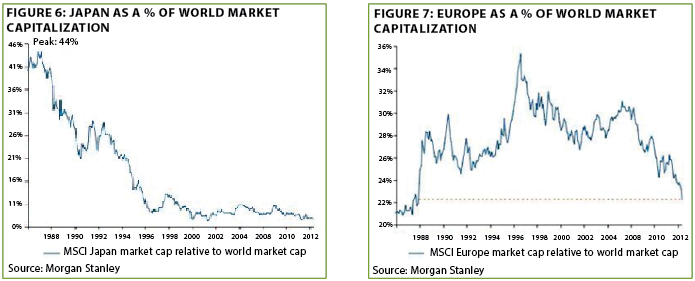
10. While the US stock market’s valuation as a percentage of the global total has remained fairly steady over the past 15 years, Europe and Japan have seen major shrinkage. (See Figures 6 and 7)
11. Finns are livid with Nokia’s American CEO, Stephen Elop, who received a $24 million signing bonus to return to Microsoft immediately after arranging the sale of what once was Finland’s proudest company to the software giant. Ironically, Mr. Elop received $1 million in bonus for every $1 billion of market value Nokia lost during his tenure at the helm. (So much for pay for performance!)
12. Highlighting the ongoing malaise in Europe, car sales in August on the Continent fell to the lowest level since 1990. Meanwhile, France is once again raising taxes on its beleaguered private sector despite an overall tax take of 46% of GDP. Government spending remains near a shockingly high 57% of GDP.
13. Although Japan’s government is the most debt laden in the developed world, its corporate sector is overflowing with cash. Japanese companies are sitting on $2.2 trillion in liquid assets, versus $1.8 trillion held by corporate America. However, Japan’s GDP is just one-third that of the US.
14. Various prior EVAs have been critical of China’s spending frenzy on questionably productive infrastructure projects. However, its high-speed rail system looks to be money well spent. Traffic has been growing at over 25% annually for the past several years and by early next year it is expected to handle more passengers than the 54 million who travel by air in the US each month.
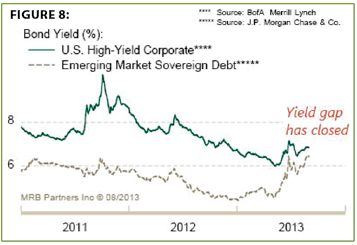
15. In another example of the cheapness of emerging market bonds, their yields are now very close to those of US junk bonds despite, in most cases, higher credit quality. (See Figure 8)
Up, up, and away? Ok, I admit it—I’m a hoarder. Not of knick-knacks or canned food, but anyone coming into my office will see stacks of articles, research reports, and other dust-coated documents that most people would have thrown away long ago.
Occasionally, I do attempt to weed out my files—a formidable and grueling task which I recently attempted. In doing so, I came across an article from 2007 covering a lively debate between two famous (at least in the investment world) Jeremys: Mssrs. Grantham and Siegel. The first Jeremy is the "G" in GMO, one of America’s largest and finest money management firms, while the latter is the renowned Wharton professor and author of the 1990s best-seller, Stocks for the Long Run.
In their opinion exchange they staked out opposing positions with Jeremy G. arguing for a coming bear market in stocks and Jeremy S. downplaying the risks. Well, we all know whose viewpoint was ultimately vindicated.
Coming across this piece causes me to feel the need to reiterate a point I made a number of months ago: I continue to be amazed that almost precisely the same collection of gurus are warning about the market today who were alarmed six years ago. Similarly, almost to a man or woman, those who were waxing bullishly in 2007 are at it again—including the two Jeremys. There’s also another high profile individual who was warning of a housing debacle back then who is once more breaking the glass on the fire alarm.
Last week’s EVA was largely devoted to Professor Robert Shiller and the cyclically adjusted P/E ratio he has made famous—and controversial—in the world of professional investing (hopefully, that’s not too much of an oxymoron!) Coincidentally, Dr. Shiller was interviewed on CNBC at almost the same time last Friday’s EVA was winging its way to you at the speed of light over the internet. His comments on the stock market were quite interesting and worthy of reflection given that he nailed the tech bubble before that blew up, in addition to his prescient call on housing.
Essentially, he said that he couldn’t decide if we were on the verge of a bear market in stocks or a new bubble. In case you think that’s a total cop out, I disagree. Past EVAs have stated that there is a distinct possibility of a final speculative orgy. Notice, however, that he did not hold out the possibility of a new secular (i.e., long-term) bull market, as many other pundits are asserting.
The reality is that, if he’s right, it really doesn’t matter. Whether the market goes vertical for a spell before it plunges down at an equivalent slope, it will wind up pretty much in the same place once the dust settles, likely at some kind of discount to fair value.
Of course, "fair value" is a tricky number to come up with but, based on the historic mean since 1950 for "the Shiller P/E" (per Point to Ponder 3 above, for those of you who missed last week’s issue), about 20% lower is a reasonable approximation.
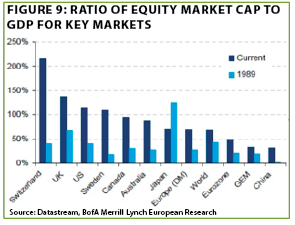
As previously noted, this corresponds to several other reliable long-term valuation measures including one of Warren Buffett’s favorites--market value relative to the size of the economy. On this basis, you can see from the following chart that the US market is the most expensive in the world, save for Switzerland and the UK, which have massive financial sectors relative to their economies. US equities compared to GDP are also far above their 1989 level (as is true of most markets).
The problem is that markets do consistently overshoot on both the upside and downside. Therefore, a plunge to 20% below fair value is not unreasonable even though it has happened only once in the last two decades. Thus, it’s possible, though far from certain, the market could tumble as much as 40% from its current level in the not-too-distant future.
The other, more near-term, problem is that, should we experience a classic blow-off top, the typical retail investor is likely to get badly burned during the rapid descent back to earth. As legendary market technician Bob Farrell has often noted, the public buys the most at the top. Unfortunately, I’m afraid a final speculative surge, likely to suck in large sums of performance-chasing money, is a very real possibility.
There are several possible catalysts for this potential upside climax. For one thing, we will soon be moving into the seasonally strongest time of the year. For another, the budget fiasco in Washington should be resolved in the next few weeks. Then there is the on-going money dump by the Fed that is unlikely to be turned off between now and year-end. Putting it all together, the ingredients are in place for what could be one wild and intoxicating Holiday party as we move into November and December.
Moreover, there are already some very eerie echoes of a time long ago when speculation reigned supreme.
Older but not necessarily wiser. We’ll never make that mistake again, right? We’ve learned too much about the vicious aftermath of bubbles to fall into the same trap of valuing companies at 100 times their annual earnings. Or have we?
Lest you think the days of astronomical P/Es on alluring growth stories have gone the way of Pets.com, please take a gander at the following table:
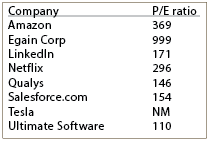
Even a cursory review of the above would give one the impression that there is just a touch of froth in today’s market. In the case of Tesla, there are no earnings yet, despite its excellent cars. However, its current market capitalization is $22 billion, which does seem to anticipate Tesla’s profits accelerating at a rate comparable to the 0 to 60 performance of its new sedan (and that the car won’t turn out to be as explosive as its stock has been, despite the recent event here in Seattle).
Undoubtedly, the above are all exciting companies with bright futures but their astronomical P/Es are a total recall of the dot.com mania. These and several others, including Pot Belly Sandwich Shop, which is enjoying a first day of trading feeding frenzy pushing its shares up 130%, have become the new cult stocks. Then there is Twitter waiting in the wings to join in the ebullience of multi-billion dollar market values lavished on profit-light "story stocks". Despite Jim Cramer’s fondness for many of them, which he reiterated last week, the history of buying very high multiple stocks with sexy stories late in a bull mark is one of dashed dreams and pulverized portfolios.
The aforementioned GMO has arguably the best long-term record of forecasting future returns for various asset classes (like international bonds). Their projections for what major market sub-sectors would produce over the next decade at the close of the nutty ‘nineties was uncannily accurate, as the table below clearly illustrates. (By the way, although they didn’t forecast future gains from Master Limited Partnerships, MLPs performed far better than even REITs.)
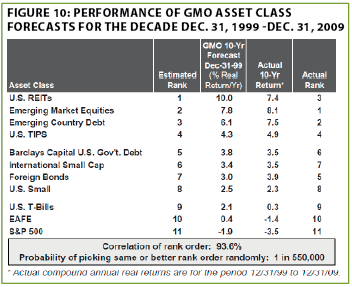
These days, unlike at the end of 1999 when there were numerous undervalued areas, GMO is predicting disappointing results for every major market segment. However, the three worst, with actual negative projected real returns, are US stocks overall, US small cap issues, and international small cap, echoing our long, and premature, disdain for small cap shares. (Additionally, I’d go out on my usual limb and opine that a collection of 100 plus P/E stocks will fare much, much worse.)

The "stars" according to GMO, if you can call them that, are anticipated to be high-quality US and emerging market equities. Bonds are also predicted to generate below-average returns, but the summer bloodbath in fixed-income markets around the world (ex-Chinese dim sum bonds and Japanese government debt) has at least brought them up to mediocre forecasted levels. Moreover, Evergreen believes that by targeting certain depressed niches in the yield complex, attractive after-inflation (real) returns are probable.
This leads me to an observation that the 20% bolt in US stocks this year, after a 16% pop in 2012, has caused many investors to forget that over the last 13 years stocks have returned just 3.5% annually. This is substantially below the average yearly gains by Evergreen income portfolios using individual yield securities over that timeframe. Of course, this year our all-income and balanced portfolios look like absolute tortoises compared to a stock market on steroids but, then again, remember it wasn’t the hare that won the long race.
If you’re wondering which investment segments will perform best over time, I’d suggest looking no further than GMO’s latest return projections—even if that’s not exactly what you’d like to hear. And be prepared for the possibility of one more euphoric moon shot by stocks before gravity takes over, as it always does.

IMPORTANT DISCLOSURES
This report is for informational purposes only and does not constitute a solicitation or an offer to buy or sell any securities mentioned herein. This material has been prepared or is distributed solely for informational purposes only and is not a solicitation or an offer to buy any security or instrument or to participate in any trading strategy. All of the recommendations and assumptions included in this presentation are based upon current market conditions as of the date of this presentation and are subject to change. Past performance is no guarantee of future results. All investments involve risk including the loss of principal. All material presented is compiled from sources believed to be reliable, but accuracy cannot be guaranteed. Information contained in this report has been obtained from sources believed to be reliable, Evergreen Capital Management LLC makes no representation as to its accuracy or completeness, except with respect to the Disclosure Section of the report. Any opinions expressed herein reflect our judgment as of the date of the materials and are subject to change without notice. The securities discussed in this report may not be suitable for all investors and are not intended as recommendations of particular securities, financial instruments or strategies to particular clients. Investors must make their own investment decisions based on their financial situations and investment objectives.