
“I understand that professional investors must take the world as it is, not as it might be, or used to be. Then, too, many of today’s allocators of other people’s money are under orders to match an index. They invest not as they want but as the index makers command them to.”
–JIM GRANT
At the beginning of 2018, we initiated a new EVA series titled “Bubble 3.0” with excerpts from David Hay’s upcoming book titled “Bubble 3.0: How Central Banks Created the Next Financial Crisis”.
If you are just joining us in the middle of this ongoing series, which will eventually culminate in a full-length publication, please read the prior installments in the series here:
In this month’s Bubble 3.0 missive, David discusses the intersection of passive investing and the bond market. Also, back by popular demand, we have provided a summary of this week’s newsletter, and will continue to do so for most of our longer newsletters.
SUMMARY
BUBBLE 3.0: THE INTERSECTION OF BUBBLE AND BUBBLE
My hometown of Seattle is a quirky place. For one thing, considering that it has a relatively small population as far as major cities go, it has been blessed with an unusual number of world class companies. The “old economy” stars such as Boeing, Costco, Starbucks, and Paccar are impressive enough. But it’s the “new economy” companies such as Microsoft and Amazon that are the real heavy-hitters, especially based on market value. How many other cities, including LA and New York, are the headquarters for two $1 trillion dollar market cap companies? (All three are actually slightly below $1 trillion as of today.) Answer none, because there only three, the other being Apple. Further, this also doesn’t include a plethora of smaller Seattle area tech firms that have substantial market values.
Despite all this, Seattle has an ambivalent attitude towards capitalism. The city’s politics have long been among the most leftward-leaning in the U.S. Well in advance of the national trend to cozy up to socialism, the Seattle City Council has included a strident socialist.
Yet, even though the Seattle-area basically controls statewide policies, due to being relatively populous compared to the rest of the lightly-populated state, Washington has never passed an income tax. This is another peculiarity along with our area’s legendary affinity for strange coffee drinks and outrageously hedonistic parades. Moreover, this ultra-liberal city has a rabid passion for a pastime that is as retro-American as an old Norman Rockwell magazine cover: football.
For newcomers, among the most bizarre aspects of Seattle life is its road system, specifically the addresses. Someone with a weird sense of humor long ago decided it would be a good idea to identify streets running east and west with the abbreviation NE, NW, SE, or SW BEFORE the street number. What’s strange about that, you may wonder? Well, here’s where it can get surreal: those streets running north and south have those initializations AFTER the number. Consequently, it’s not uncommon-to see a home or business located at NE 148th and 148th NE, or SW 50th and 50th SW. It’s definitely confusing but it is vintage Seattle.
It’s another intersection that is the subject of this week’s Bubble 3.0 EVA, that of passive-, or index-, investing and the bond market. It was quite common several years ago to read and hear about the great Bond Bubble. Perhaps because US interest rates have risen a decent amount, references to a bubble in fixed-income has died down to a nearly inaudible whisper (however, they remain at levels that prior to the financial crisis of 2008 only prevailed during severe recessions, if then) Or perhaps because bond prices have been so high for so long that the naysayers have been worn down into submissive, if incredulous, acceptance. (Note, this also means interest rates have been low for just as long; bond yields and prices move in opposite directions.) As with stocks, a bull market that goes on long enough starts to look like it will never end—usually, right before the big pop happens.
Chapter 5 of this extended EVA series on Bubble 3.0 was titled “The Biggest Bubble Inside the Biggest Bubble”. It asserted that global bond markets were at the highest prices—again, that means lowest yields—in human history. That chapter/EVA issue further made the case that it was this unparalleled overpricing of bonds that set off a chain reaction throughout nearly all investments types, known in the financial business as asset classes, driving these up to bubble-like levels. In other words, bonds have been the main helium provider for Bubble 3.0. This makes sense given that central banks have intervened the most flagrantly in the debt markets.
Last year’s fourth quarter graphically demonstrated how reliant financial markets are these days upon keeping interest rates at Lilliputian levels. For a time last year, it looked as though negative-yielding bonds (where the lender pays the borrower for the use of the former’s capital) might be heading the way of the dodo bird and the Studebaker. Instead, in 2019, negative-yielding debt has made a rousing comeback with either $10 or $11 trillion in existence globally, depending on the statistical source. Regardless, it’s a long way from extinction.
In the US, it appeared as recently as last October that the 10-year US treasury might rise as high as a 4% yield, likely pushing corporate bonds into the 5% to 6% range. This would have provided retirement plans, insurance companies, and millions of older American investors an opportunity to secure at least a respectable return on a vital part of their portfolio. But, alas, 3 ¼% was the peak, briefly, and now the 10-year T-note yield is back down to a somewhat miserly 2.4%. And, as many EVA readers are aware, this has caused parts of the treasury yield curve to invert (where short-term rates are higher than longer-term rates).
As usual during the early- to mid-stages of a Fed tightening cycle, the stock market blew off the persistent hikes. Numerous EVAs from 2017 and 2018 warned this was a mistake and that the Fed would keep hiking until something nasty happened, like last year’s fourth quarter market mayhem. Similarly, perma-bulls dismiss an inverting yield curve, coming up with all kinds of clever reasons why inversions no long matter.
After the sheer panic of 2018’s last three months, we are back to euphoria. To see that, one has to look no further than the current IPO market in the US where companies with multi-billion market values are going public at a dizzying clip. This, in and of itself, is indicative that the decade-long US bull market has entered the bubble stage. Some of these supposedly hot new issues are bombing not booming, just as they did in early 2000, during the dying days of the great 1990s bull market.
First, Lyft de-lifted after a brief initial pop. It is now down 25% from its IPO price. Then, the much larger Uber was priced last week. Despite a significant pre-offering price reduction to avoid Lyft’s sorry fate, Uber closed under its IPO price by 19% (it is now-6.6% below its IPO price). Because of its initial $80 billion valuation, Uber destroyed more public shareholder wealth than any other new issue, save one, since 1975.
There are, of course, multiple reasons for the resumption of the equity mania part of Bubble 3.0 but the dramatic fall this year in long-term interest rates clearly has played a role. For one thing—and it’s a very big thing—it has encouraged companies to continue to run the great buy-back machine full-out. As one of the keenest economists in North America, David Rosenberg, has noted, companies repurchasing their own shares has accounted for about 30% of the earnings per share increase seen over the past decade. Perhaps it’s just a coincidence but the Fed created roughly $4 trillion of fake money during its three QEs (Quantitative Easings), US companies have added about $4 trillion of additional debt, and they have also bought back about $4 trillion of shares. Maybe I’m just too cynical but this seems like more than just a random series of events to me.
When longer rates were rising last year and, critically, credit spreads* were, too, companies began to discuss deleveraging (ahh, now there’s a quaint notion!). But with the latest downdraft in longer-term yields and a significant retracement in credit spreads, buy-backs continue to run at a trillion-dollar annualized pace.
My point is that interest rates, including credit spreads (which indicate whether the corporate cost of capital is rising or falling relative to government borrowing costs), are enormously important. And interest rates are not just pushed around by what the Fed is doing, which in turn is reacting to business conditions and inflation, they are also a function of the credit quality of the underlying bonds. The worse the credit metrics, the higher the interest rate. Thus, it’s disturbing to see how much US corporate credit quality has eroded. If you think it’s just the worry-wart in me coming out again, consider some recent commentary from none other than the entity most responsible for this erosion, the Federal Reserve. The below is courtesy of The Macro Tourist and its generally up-beat author, Kevin Muir (to access his full May 7th note on this topic, please click here):
“Yesterday, in their latest financial stability report, the Federal Reserve highlighted the alarming growth of private sector borrowing.
From Bloomberg:
‘The Federal Reserve escalated its warnings about the perils of risky borrowing by businesses Monday, saying firms with the worst credit profiles are the ones taking on more and more debt. The Fed also left a question unanswered: Is it going to do anything about it?
The U.S. central bank’s latest financial stability report said leveraged-lending issuance grew 20 percent last year, and that protections included in loan documents to shield lenders from defaults are eroding. While the Fed board voted unanimously to approve the report, it didn’t indicate any course of action the governors might take to rein in the red-hot market.’
This Federal Reserve report is a big deal. The language makes it clear they are worried about the rising amount of private sector debt.
And for good reason. Take a gander at this terrific chart from Bloomberg (G #BTV 6468 for BB users):
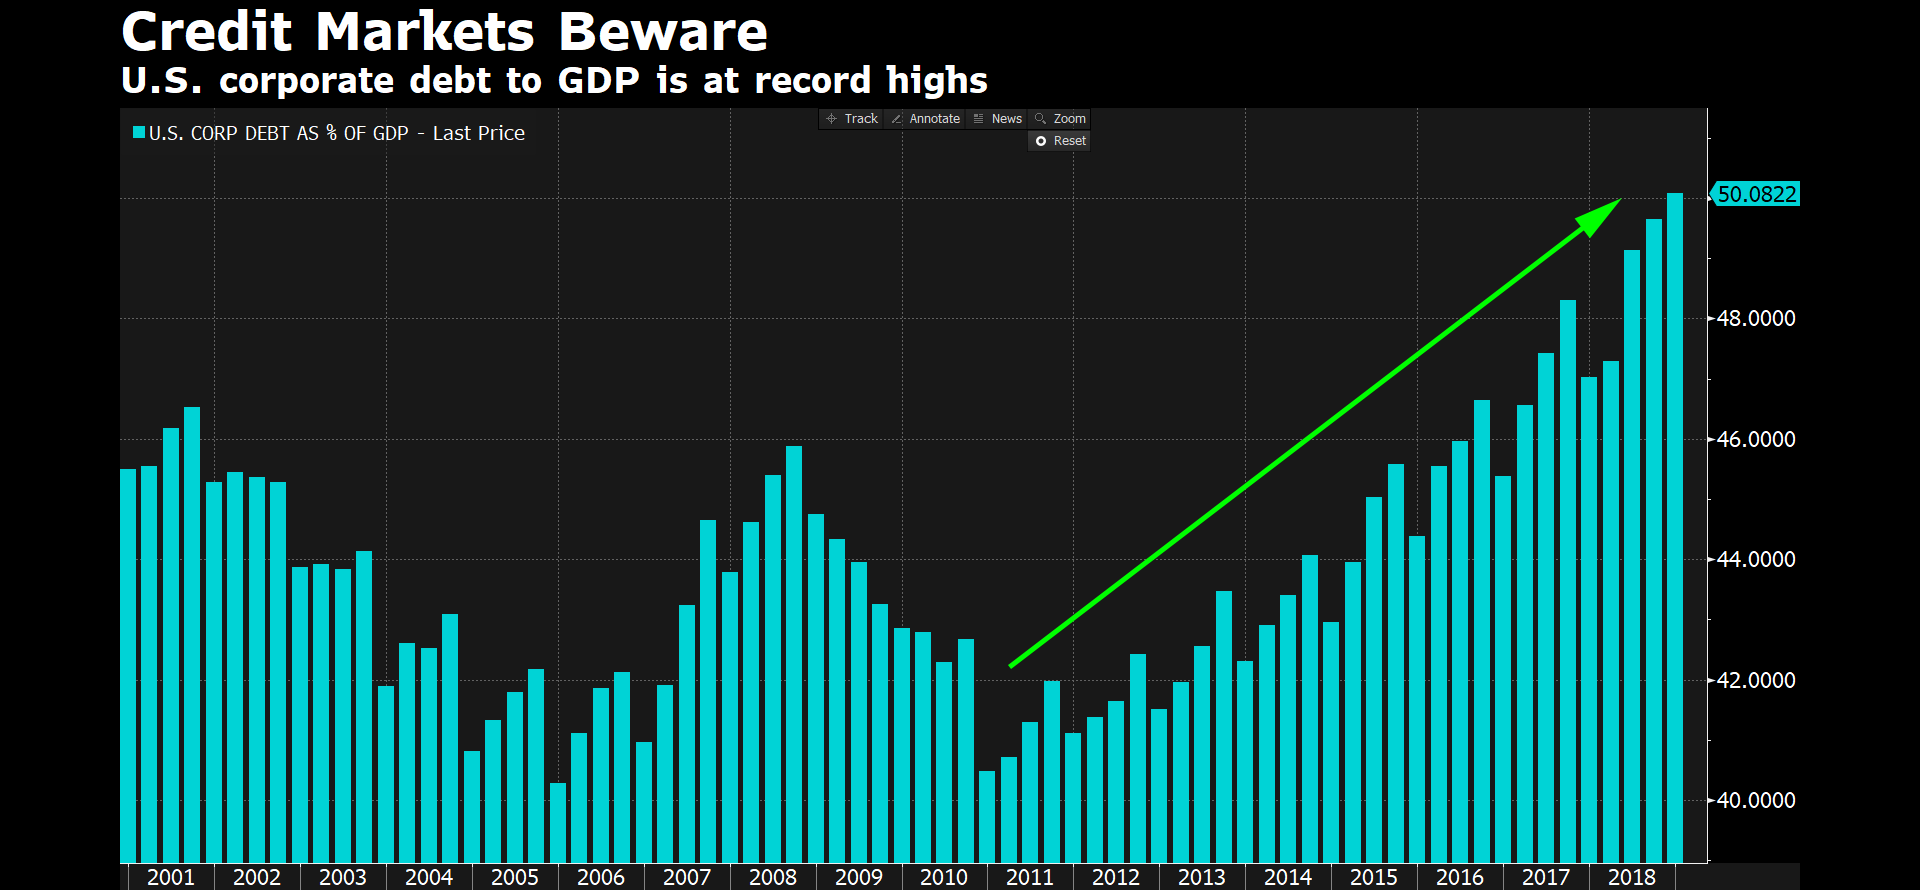
This chart doesn’t resort to the usual trickery of measuring debt in absolute dollars (it’s like man-scaping - it makes it look bigger than it actually is), but uses the much more appropriate debt as a percent of GDP figure.
Yet even with the proper measurement, the growth in corporate debt since the Great Financial Crisis is nothing short of stunning. We have tacked on 900 basis points of GDP in debt!”
Kevin’s right, the levering up of corporate America is truly stunning—and, potentially, stunting. Debt at these levels has a very real likelihood of stunting growth in both the economy and corporate earnings. In fact, it probably already has (for a detailed overview on this topic, please use this link to access an article by the esteemed Lacy Hunt on the growth retarding effects of excessive debt).
Again, much of the cause of this debt binge has been stock buy-backs. One of the dirty not-so-little secrets of the share repurchase craze is that it means lower overall profits than in their absence. This is due to increased interest costs, at least for companies that need to borrow to fund the buy-backs, as many clearly have.
Without a doubt, the collapse in yields the Fed engineered has obscured this expense, at least until it boosted rates nine times in recent years. Yet, it only took a 2 3/8% fed funds rate to cause a quasi-panic at the end of 2018. It’s nearly a given that the chart shown above is one reason why. Another is the proliferation of so-called “leveraged loans” the Fed alludes to in its corporate debt warning. The share of these has now surpassed the levels seen in 2007 and 2014, the former instance being right before the greatest financial crisis since the Great Depression.
The leveraged loan market grew by 20% last year and now totals $1.1 trillion. As the Fed observed in the above report, it’s the riskiest, most leveraged companies that are frantically piling on more liabilities.
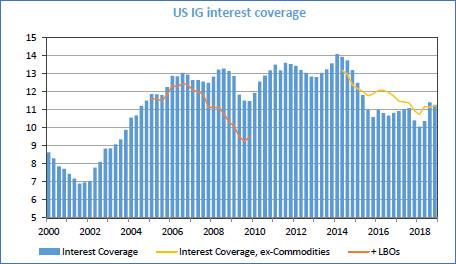
These loans tend to be floating rate, meaning that the cost to service them has risen materially over the last two years. According to Jesse Felder, author of the factoid-rich newsletter bearing his name, “It’s amazing to see that, despite some of the lowest spreads in history, median interest coverage today among corporate America is even worse than it was during the depths of the financial crisis. It’s a testament to just how crazy the current credit cycle has gotten.”
What’s particularly surprising about Jesse’s comment is that the culprit isn’t the junk bond market at this point. As you can see in the charts below, it’s actually investment grade debt that has coverage worse than in 2009. (IG stands for investment grade, and HY stands for high yield.)
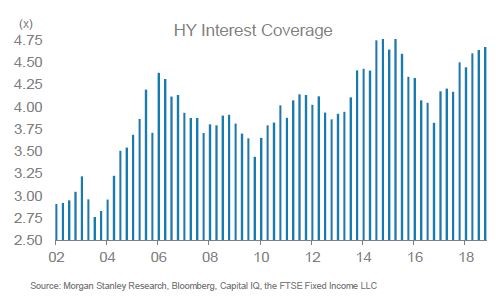
Yet, two of the world’s foremost experts on the junk bond market have noted another oddity. The March 22nd Grant’s Interest Rate Observer (GIRO, not to be confused with gyro), beloved by many of the planet’s most illustrious investors, noted that among the best reflectors of the junk debt market’s “quality”, so to speak, is the overall percentage of high yield that is rated CCC to C. This the lowest rung outside of those already in default. Prior to the onset of the Great Recession, roughly 29% of the junk market was in this lowly category. As of January of this year, it amounted to nearly 44% of the total. That’s obviously an eye-popping number. In fact, so much so that it caused us to contact Jim Grant’s team because the junk BOND market itself didn’t appear to be that “junkified”, per the above chart and others similar to it.
The reason for the all-caps in the preceding sentence relates back to the aforementioned leveraged loans which have now become large enough that they are impacting the credit quality of the overall junk market. In other words, the latter is a combination of both bonds (typically with fixed rates) and loans (as noted, generally floating rate). We doubt this situation is widely known as most focus on just the junk bond market.
But as the GIRO article quoted Marty Fridson, widely considered to be THE authority on high yield debt, this is a big deal, and a bad one at that: “But let’s not even consider the further increase in the CCC to C component that’s likely to occur by the time the next recession commences…The predicted one-year default rate from this calculation is 15.63%. That compares with a 12.1% peak calendar-year default rate in 2009.” In other words, there is a very real potential for the junk bond market’s breaking-bad rate to exceed that seen during the worst economic collapse since the 1930s. No wonder the Fed is belatedly suddenly waking up to this looming calamity.
This leads me back to my title, one that probably had a lot of EVA readers scratching their heads—just as many Seattle addresses do to perplexed drivers. My overarching thesis is that we are seeing a dangerous intersection of bubbles in corporate debt (including loans) and indexed investing.
Evan Lorenz from GIRO wrote on that topic in their March 22nd edition. To wit: “A blow-up in high yield (junk) defaults would cause special problems for such ETFs** as the Invesco Senior Loan ETF (BKLN) and the iShares iBoxx High Yield ETF (HYG)…(the underlying) loans and bonds are notoriously illiquid—they trade by appointment—whereas the sponsors of BKLN and HYG promise their investors daily liquidity.”
You don’t have to be wearing your Bear Goggles to see how this could quickly morph into a major problem. Even Dallas Fed president Robert Kaplan stated – or, more accurately, understated – this week that: “In the next downturn, I think this amount of corporate debt is going to be a burden”. On Monday, the new Bond King Jeff Gundlach, chimed in: “the corporate bond market will really have a problem when you see negative GDP.” Then, referring to Warren Buffett’s famous quip that you see who’s been swimming naked when the tide goes out, His Majesty of Bonds added: “It’s kind of a nude beach out there.”
But, wait, you might reasonably protest, we’ve got the lowest unemployment in 50 years and the US economy grew 3.2% in the first quarter...valid points, those. Nonetheless, here’s what the NY Fed’s Recession probability is revealing right now:

How could these seemingly contradictory conditions co-exist? First, as mentioned in prior EVAs, unemployment is the ultimate lagging indicator. Also, on this topic, there is another key labor market measure called the Household Survey. Historically, it has been much better at forewarning of a rise in unemployment. On this basis, job losses are accelerating. This happened right before the Great Recession, as well.
Second, the first quarter growth rate was unduly flattered by both a surge by inventories (never a good thing) and an unsustainable fall-off by inflation (lower inflation raises real GDP since it is an after-inflation number). Per David Rosenberg: “Nominal GDP growth…slowed sharply in the first quarter to just a 3.8% annual rate…In fact, nominal growth is lower now than on the eve of all 9 prior recessions over the past 60 years.” The bottom-line is that the US economy continues to lose altitude. As previously noted in multiple past EVAs, this is the typical result of a long Fed rate-hiking campaign.
My key point in this regard is that both stock and corporate bond investors are much too relaxed about the risks of recession to companies’ profits and balance sheets. Thus, should the threat of a contraction continue to rise—very much a non-consensus view at this time—the reaction could be as violent as it was six months ago.
Morgan Stanley recently addressed the risks posed by the corporate debt explosion. They cited the 1990s as another time when corporate debt soared by 137% and underwriting standards eroded. This debt binge, and the lax credit terms that accompanied it, led to the devastating bear market in corporate bonds in the early 2000s.
Next, was the notorious real estate bubble from 2002 to 2007 when property-related debt vaulted by 110% and almost anyone who could fog a mirror was able to take out a mortgage…if not several. So far in this cycle, corporate debt has surged by 119%, which works out to $4 trillion as cited earlier, a number that is still rising. The main point by Morgan Stanley is that when leverage doubles in a particular area, really bad things tend to follow.
During this latest debt orgy, borrowers have been able to secure extremely lenient terms, just as was the case in the late ‘90s. Rating agency Moody’s commented a few weeks ago that lender protections are close to the worst on record. For leveraged loans, many borrowers are using farcical cash flow “add-backs” that assume costs cuts that haven’t happened yet. These are currently running at nearly 30% of total deal related cash flow (EBTIDA) totals. Suffice to say, this is very, very aggressive accounting and the kind of reckless behavior often seen after a long credit boom.
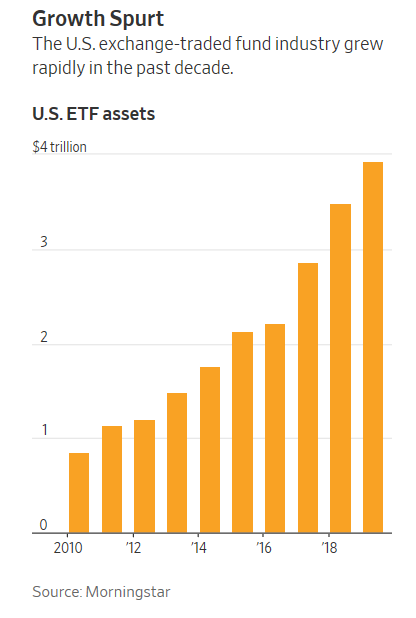
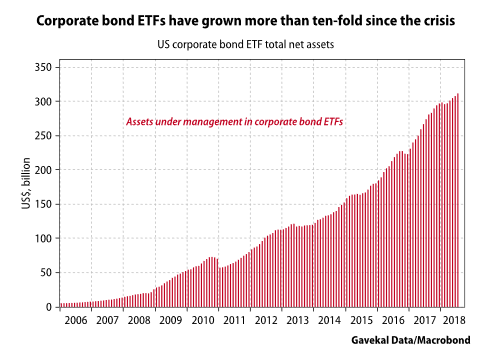
While it’s well known that flows into stock ETFs have gone postal during this bull market, less top-of-mind is that the same thing has happened with bond ETFs. Per the charts below, most of the inflows have been into equity ETFs but corporate bond ETFs have increased by 1000% over the past decade.
Moody’s has also observed that ETF investors “may be in for a shock during the next sustained market rout”. They opine that this is especially the case with ETFs that hold lightly-traded securities such as corporate bonds and loans. This could lead to a potentially jarring collision between perceptions and reality. ETF investors think they can get out of even junk bond and sub-investment grade bank loan ETFs on a moment’s notice. To a point that’s true. If they hit the sell button at their on-line broker, they’ll be out instantly. But if they do so during another period of mass liquidation, they’ll get a horrible execution price. In my opinion, this is almost certain to happen in the not too distant future, particularly given that corporate bond volumes have contracted so dramatically in recent years. For example, since 2014 junk bond trading volumes have vaporized by 80%. Thus, the bond market is dangerously illiquid these days, a fact many others have noted, including my close friend, Louis Gave.
But there are a couple of other “yuge” problems I would like to point out as this latest chapter on Bubble 3.0 comes to a close. The first relates to the credit exposure index/ETF investors are incurring, often without their knowledge. By definition an index-tracking fixed-income ETF must hold positions of a size equal to the underlying index. That’s kind of a “duh!”, versus “aha!”, moment, right? Yet there’s a key difference here compared to equity index funds where that is also true. By that I mean with stock index funds one could argue (though I wouldn’t, necessarily) that the most profitable and successful companies are those with the largest market values and thus deserve to be the most heavily represented. (My quibble with this is the historically poor future returns the largest cap entities have generally produced.)
With bonds, though, it’s a much different story. It is the companies with the greatest amount of debt that have the biggest weightings in a passive bond ETF (there are some active ones where this isn’t the case). This is why GM was such a big junk index holding back in 2007—around 2%--two years before it went into bankruptcy. (GM was in the investment grade index until 2005 when it was downgraded into the junk bond index. It was eliminated from that in the summer of 2008 but GM bonds were already at a 40% to 50% discount from face value at that time.)
An illustration of this reality today is with AT&T and comparing that to another major debt issuer that starts with an “A”, as in Apple. While AT&T is unlikely to follow GM’s sad path, it does have nearly $200 billion in outstanding debt. Yet, its stock market cap is “only” $230 billion. Apple has the aforementioned nearly $1 trillion equity capitalization, yet its debt is a comparatively minor $110 billion (much more minor when considering Apple’s cash hoard totaling $225 billion). Said differently, AT&T represents 2.5% of the investment grade bond index versus just 1% of the S&P index. Apple is the opposite, representing close to 5% of the S&P but only 2% of the bond index. Thus, a bond investor has more exposure to the highly-levered AT&T versus the cash-heavy and debt-light Apple, with the latter having an equity market value nearly five times that of the former.
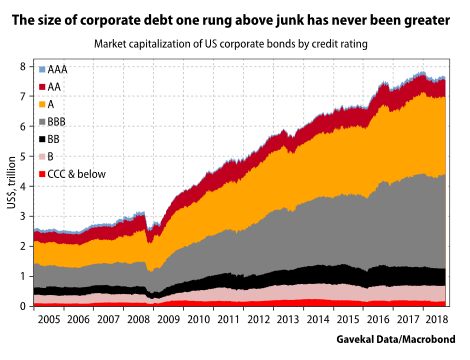
Currently, investment grade bond ETFs have never been as low quality as they are now because they must reflect the underlying credit quality of the “high-quality” corporate bond market. And, as you can see in the following chart, half of it is just one notch above junk. In addition, leverage (debt relative to cash flow) for the index is near the highest level ever. In fact, according to Jeff Gundlach, over one third of these issuers would be rated junk on leverage metrics alone.
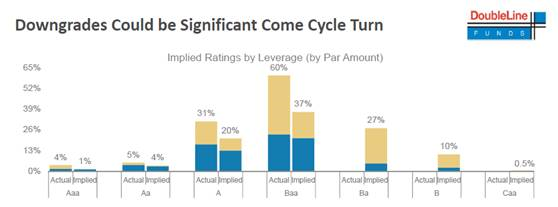
Consequently, in the next recession, it’s almost a given that huge sums of BBB-rated debt, the rung right above junk, will be downgraded to that status. The crucial part here is that many institutions can’t hold less than investment grade (i.e., junk) debt. Therefore, when downgrades to junk status happen all of these investors are forced to sell, causing a literal cliff-dive in the price of what was once a safe, low-volatility security. Obviously, the index/ETF vehicles that are such big holders of this junk debt-in-waiting issues will take it on the chin—if not the solar plexus, too.
Importantly, the municipal bond market also has all the makings of another credit cataclysm. One of the biggest victims of our interest-rates-gone-missing times are state and local governments, the issuers of tax-free debt. The financially frailest states and municipalities also tend to be the ones, logically, with the largest unfunded retirement liabilities. Rock-bottom interest rates greatly exacerbate these short-falls.
It’s nearly certain that during the next recession these entities will become even more stressed and a number may actually default. Yet, if you look at the largest municipal bond ETF, it is chock full of bonds from regions of the country that have future financial crisis written all over them. (By the way, I would include California in that category even though it looks healthy for now. Over the years, it has made its tax base increasingly vulnerable to the next bear market in stocks and real estate.) Many other actively managed muni funds are also loaded to the gunnels with these “securities”, likely to goose their interest rates in order to lure in yield-hungry investors (who isn’t these days?). Consequently, it’s uber (sorry) critical for municipal bond investors to check out the underlying credit quality of the funds in which they are invested.
But there’s another danger in indexed bond investing that gets little press and it relates to what the Fed-engineered diminution of yields has done to interest rate risk. This is because as the yield on a bond goes down, its duration goes up. Before your mind shuts down due to the word “duration”, let me explain this fundamental bond market concept. Imagine three bonds, all due in 10 years. The first pays 10%, the second pays 3% and the third pays nothing (a so-called zero-coupon bond, typically bought at a discount—though not in Europe and Japan where they trade at premiums due to negative yields!)
With the first bond, you get much more cash flow in the early years due to the high face interest rate (or coupon) of 10%. So, assuming it’s a 10-year maturity, in five years an investor has received half of his money back in the form of interest (plus a bit more assuming reinvestment of the cash flow). But with a 3% bond, also due in 2029, only about 15% has come back to the investor. Thus, the duration of the two bonds are very different even though they have the same 10-year maturity: 6.75 years for the 10% bond and 8.79 years for the 3% issue. Based on the fact the zero-coupon bond pays nothing until maturity its duration is the same as when it comes due, or 10 years. Back on April 15th, Investors’ Daily had a trenchant article on this topic explaining that the total amount of global investment grade bonds has doubled to $52 trillion since 2007 (this includes government as well as private debt). Yet, over the same timeframe, yields have tumbled by more than half, to 1.8%. As a result, the duration on the planet’s stock of investment grade debt is now around 7 years, close to a record high.
Think about these twin bond risks (credit and interest rate) for a second. If you are simply buying a bond index you are assuming a greater amount of credit risk as companies leverage up in a bull cycle (especially this one where $4 trillion has been spent on buy-backs). You are also incurring an increasing degree of interest rate risk the lower rates go (due to the duration effect just explained). Does that sound like a smart move to you?
Presently, Evergreen is much more concerned about credit risk than interest rate risk. This is the opposite stance we’ve had for most of the last four years when we positioned to short-maturities, mostly BBB- and BB-rated corporate bonds, in anticipation of the Fed’s attempt at interest rate “normalization”. (Since they were only able to get to 2 3/8%, one could say they only made it half-way to normal but this is definitely an area where the term “new normal” applies.)
Accordingly, we’ve sold all of our corporate bonds ETFs—even in our ETF-based portfolios. Today, we are heavily focused on government-, backed debt with five- to seven-year maturities, as well as very short-term corporate debt where credit risk is much lower (less time for companies to get in trouble and/or default). As expressed in these pages in various earlier EVAs, we believe the next Fed move will be to cut and that during the next recession the 10-year treasury note will re-test, if not go below, the yield trough it set in 2016 at 1.3%. By the way, one of the few economists to call the last downturn, the previously mentioned David Rosenberg, thinks the US may already be in recession, though Evergreen doubts that…yet.
In conclusion, if you are planning on riding out the next stock bear market--and the likely simultaneous recession--in corporate and/or municipal bond funds, you may have a nasty surprise headed your way. Even if you are averse to active equity management, you may want to think long and hard about having your bonds managed by someone who actually thinks. In good times, brain-free investing is tough to beat. But when the hurricane makes landfall, you better have a portfolio built with careful thought—and not loaded up with what everyone else owns.
*Credit spreads represent the yield spread or gap between what the US treasury pays to borrow money and what publicly-traded corporations pay.
**ETF stands for Exchange Traded Funds, mostly passive investment vehicles where little, if any, security analysis is performed but which offer very low management fees.

David Hay
Chief Investment Officer
To contact Dave, email:
dhay@evergreengavekal.com
DISCLOSURE: This material has been prepared or is distributed solely for informational purposes only and is not a solicitation or an offer to buy any security or instrument or to participate in any trading strategy. Any opinions, recommendations, and assumptions included in this presentation are based upon current market conditions, reflect our judgment as of the date of this presentation, and are subject to change. Past performance is no guarantee of future results. All investments involve risk including the loss of principal. All material presented is compiled from sources believed to be reliable, but accuracy cannot be guaranteed and Evergreen makes no representation as to its accuracy or completeness. Securities highlighted or discussed in this communication are mentioned for illustrative purposes only and are not a recommendation for these securities. Evergreen actively manages client portfolios and securities discussed in this communication may or may not be held in such portfolios at any given time.