
“A bubble is what I get fired for not owning.”
–ANONYMOUS (POSSIBLY SOON EX-) PORTFOLIO MANAGER
“The Fed is going loco.”
–PRESIDENT DONALD J. TRUMP
At the beginning of 2018, we initiated a new EVA series titled “Bubble 3.0” with excerpts from my upcoming book (tentatively titled “Bubble 3.0: How Central Banks Created the Next Financial Crisis”).
If you are just joining us in the middle of this ongoing series, which will eventually culminate in a full-length publication, please take a few moments to review the prior installments in the series:
This month’s “Bubble 3.0” installment takes a look at “what could go right” in the US markets and economy to avoid the potentially painful scenario I have been writing about since February. Ironically, we are running this edition before we intended to, due to rapidly deteriorating changing market conditions. Suddenly, time seems to be of the essence!
WHAT COULD GO RIGHT
By David Hay
Anyone who’s been involved with the financial markets for many years—and, by the way, their numbers have shrunk considerably—realizes how rapidly times can change. It was only back in early July when we sent out the special edition of Bubble 3.0, “A Fast and Furious Challenge”, that the helium-infused market atmosphere we’ve been experiencing for years was mostly fully-inflated.
Yes, there were a few exceptions such as the precipitous collapse by Bitcoin and its co-crypto currencies, which in my mind will still go down in history as the signature mania of this latest bubble. And there were already some tremors in emerging markets and even US real estate. But, for the most part, it was bubbliness as usual.
It was in the same July issue that I promised readers I would eventually write a chapter with the title “What Could Go Right”. However, I cautioned: “…if things haven’t blown up before I do”. Based on what’s been happening recently to a variety of asset classes (investment lingo for different investment types, styles, or areas), I thought it might be prudent to tackle this theme sooner rather than later.
To be sure, for the investor who is heavily focused on the S&P 500 or, better yet, the NASDAQ, it’s definitely a case of more of the same. Up until this month, it’s been a fun run for both of those indexes, as they each puffed up another 7% in the third quarter. But for almost every other “asset class” on the planet Earth, there’s been a major tide shift. (This week, as we all know, US stocks are suddenly having a hard time swimming against the out-going current.)
Yet, in the spirit of the theme of this chapter of Bubble 3.0, (as a reminder, the sub-title is “How Central Banks Created the Next Financial Crisis”), let me expand on a notion I raised back in July – what I referred to then, and still do, as the “Immaculate Correction” scenario. A key part of this sunny outlook is that rather than a chain-reaction of collapsing asset classes, what we could see instead is a series of rolling and unconnected shakeouts or, even, in the case of Bitcoin, full-on crashes.
In other words, maybe what we’ve seen increasingly in recent months is exactly what the perpetual bull market needs to continue romping: individual dominos falling, but doing so singularly and with no contagion effect. To me, this is the most plausible supposition I’ve come across on why the economy and the S&P might continue to rise for years to come, possibly as long as a decade or more.
If this seems totally unprecedented on the economic front, please realize that the “Lucky Country” Down Under has been most lucky indeed. Australia hasn’t endured a recession in nearly 30 years! Therefore, who’s to say that the US economy can’t keep expanding without nary a downturn for another almost 20 years? Moreover, as all market mavens know, it’s rare to have a true bear market without a recession (I’ll discuss an infamous—and possibly relevant—exception toward the end of this chapter since I don’t want to be accused of totally caving into Bubblemania!).
Ergo, based on this new domino theory for the economy and markets—essentially, that there isn’t one—emerging market stocks can get slammed, as can their currencies, US government bonds can break below key price thresholds (and above equally key yield thresholds), property values can erode (in some cases, like NYC, alarmingly), central banks can soon go from massive liquidity injectors to equally massive liquidity drainers (see the chart below), and the once-heralded “synchronized global expansion” can narrow down to one lone country (the US), and, because of — not despite — all of the above, the system is made healthier.
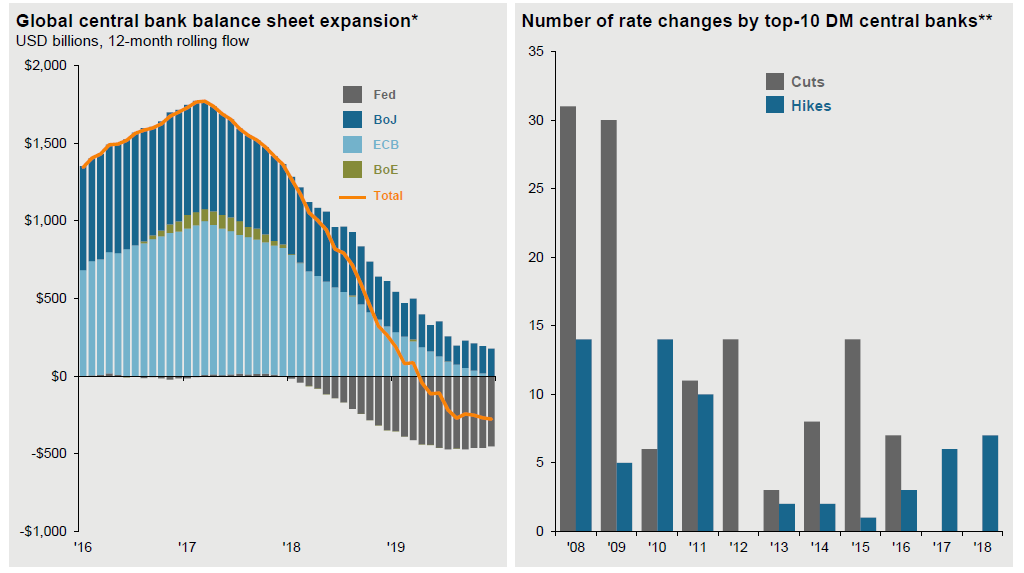 Source: JP Morgan
That one deserves a “whew” and “huh”, don’t you think? Now, all you grey beards out there just hold your horse sense. There is a logic at work here. To wit, conditions are made healthier due to the flushing out of speculative excesses. For example, who can deny the world is a better place without all the strident media coverage of Bitcoin and the millionaires-cum-billionaires it spawned? Not to mention discouraging bitcoin mining which was threatening to consume as much power as Western Europe at the rate it was growing late last year.
You’ll get no argument from me on that score. As far as I’m concerned, good riddance crypto menace. Similarly, I shed no tears when the short volatility (VIX) trade imploded early this year which was a prime factor in the so-called “Volmaggedon” that briefly pounded markets back then.
It’s a bit dicier, however, when the flushing-out process begins to involve overseas stocks, bonds, and currencies, not to mention that most sacred of all asset classes, real estate, including in the U.S. But, at least until this week’s perturbations, it’s had scant impact on the US stock market, nearly the total focus of American investors these days.
Thus, it’s reasonable to postulate that there can be a series of corrections and even bear markets in many reaches of the investment universe without tripping up the hard-charging US “Tarsus Maximus”, popularly known as the S&P 500. Of course, reasonable isn’t always right but for now even bears have to admit that the troubles overseas are almost certainly pushing investment capital into the US.
Moving to other considerations that may keep this market ripping are corporate earnings, at least in America. It may come as a surprise to many that for three years—2014, 2015, and 2016—S&P profits were largely stagnant. In fact, inside those years was a six-quarter earnings recession. Yet, the S&P vaulted 29% over that three-year period.
S&P EARNINGS (2013-2016)
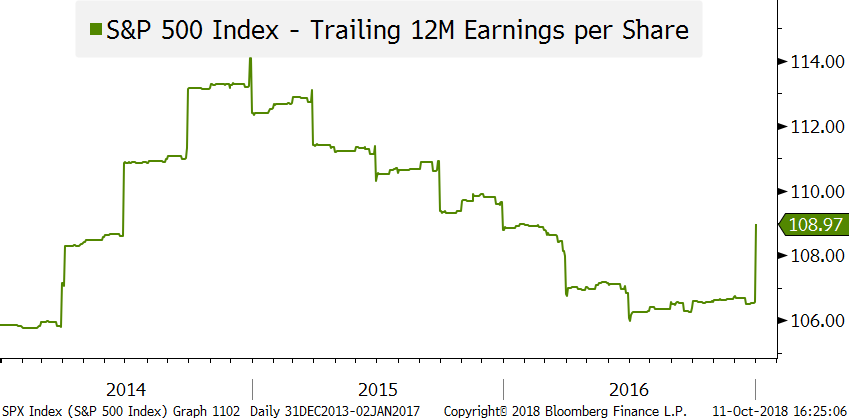 Source: Evergreen Gavekal, Bloomberg
2018 has been a radically different story. Profits have, for once, done even better than the market. While the S&P is up about 5% for the year as I write this, earnings should easily increase by 20%, if not more. The bull camp has seized on this and, as usual, extrapolated a continuation of robust earnings. Expectations are that profits will increase at a 16 ½% rate for the next three to five years. This is the most optimistic Wall Street analysts have been on corporate profits since the most rabid days of the dot.com insanity. (To ponder what happened after that last bout of euphoria runs contrary to the motif of this chapter.)
Unquestionably, the sweetheart corporate tax reform giveaway has been a super-charger for earnings this year. But it’s more than that. Sales have been increasing at an extraordinarily husky 9% plus rate in recent quarters, and that’s hard to attribute to the tax deal.
Thus, it’s possible that Trumponomics is a credible successor to Reagonomics despite the much less likeable personality of its namesake. Perhaps freeing up the US economy after years of encroaching and crushing regulations by the prior administration will allow the American economy to consistently post 4% real growth, thereby enabling its finest companies to meet those lofty multi-year earnings projections.
Let’s do a little quick math in this regard. Assuming that the S&P does earn around $160 this year, as appears probable, and then also assuming that this compounds at 15% per year for the next five years, profits per S&P share would approximate $320 in 2023. Consequently, the S&P 500 is a steal at just 8 ¾ times those projected profits!
Of course, this would mean profits would soar at almost a 12% compound clip over the ten years from year-end 2013 through 2023. That has never happened before from a point four years into a recovery, though it has happened from the bottom of recessions to the top of the next up-cycle. Usually, S&P profits rise a bit less than total (or nominal) GDP growth. In recent years, that’s been running at about 4% though this year looks to be closer to 5%, maybe even higher. That’s still a long, long way from 12%. Let’s not quibble, though. We’re supposed to be looking at the glass half-full (if not downright overflowing) scenario here.
Before we move onto the next non-stop bull market catalyst, let’s just consider why things need to break most serendipitously to keep future returns up there with what investors have come to know and love (if not lust). As far as I know, Ned Davis Research is the only firm that has back-tested for the correlation between household stock exposure and future returns. Their theory is that very high levels of retail investor equity ownership correspond with similarly low future returns. In Ned Davis Research’s words: “…the correlation is remarkable.” (Emphasis theirs!) As you can see from the chart below, this is not hyperbole.
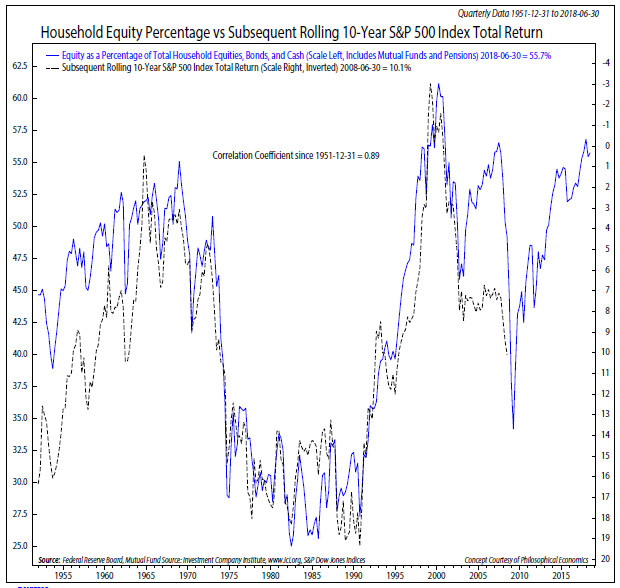
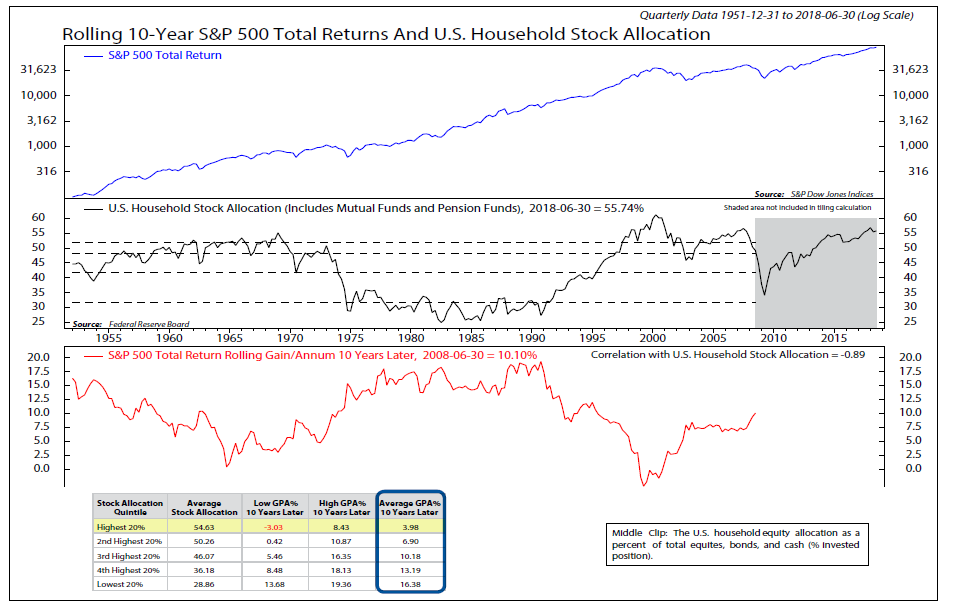 Source: Ned Davis Research
Fortunately for those who want (need?) to realize the continuation of double-digit stock market returns, they have an extremely powerful ally, the S&P 500 companies themselves. As numerous past EVAs have noted (even those unrelated to my Bubble 3.0 thesis), share buy-backs during this bull market have been unparalleled. But what’s truly astounding is the intensity of repurchases this year.
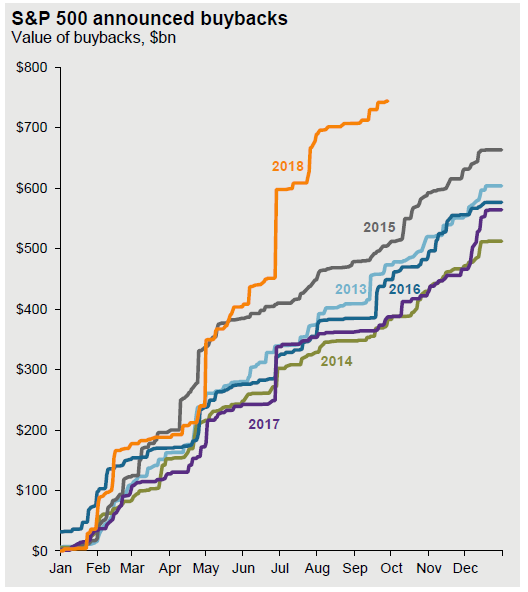
Even the grizzliest bears have to concede it’s very, very, VERY hard to have more than a garden-variety correction given this type of buying by companies themselves. Further, with corporate profits gushing, foreign funds being repatriated (providing more funding), and credit spreads very tight (meaning financing is affordable despite rising treasury rates), the senior management of most big companies are showing little inclination to dial back on buy-backs. In other words, this extreme support isn’t likely to end tomorrow.
In my increasingly humble opinion, until repurchases are discredited as value-destroyers rather than value-enhancers, US stocks will likely have a persistent bid under them. That’s not to say we won’t endure an even worse decline than we’ve had lately, but a long and grueling bear market isn’t likely until buy-backs are seen for the sham they’ve become.
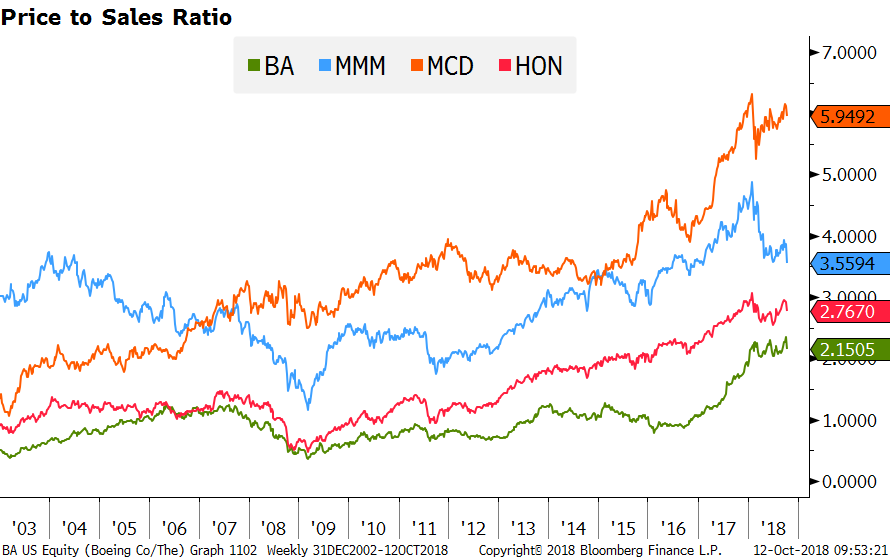
The theory that buy-backs are now harmful in the long run will be the theme of a future chapter. But, for now, suffice to say that when old-line companies such as those shown below are selling for the kinds of price-to-sales ratios they are, repurchases are now costing shareholders money—literally billions, if not trillions.
PRICE-TO-SALES (BA, MMM, MCD, AND HON)*
 Source: Evergreen Gavekal, Bloomberg
* Boeing, 3M, McDonald’s and Honeywell
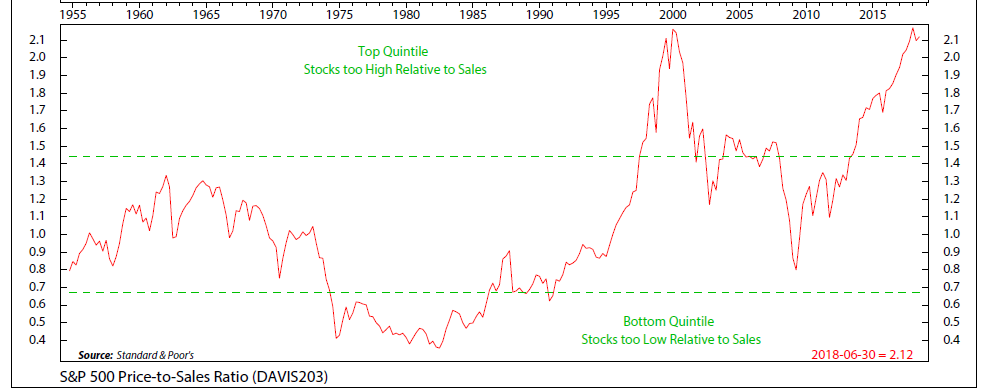
The problem with earnings is that they are, and always have been, highly cyclical. Sales are much less so (and also much harder to manipulate with creative borderline fraudulent accounting. The on-going shockingly high level of the S&P’s overall price-to-sales ratio is one of the biggest chinks in the “From Here to Infinity” bull thesis.
S&P CAPITALIZATION-WEIGHTED PRICE-TO-SALES
 Source: Ned Davis Research
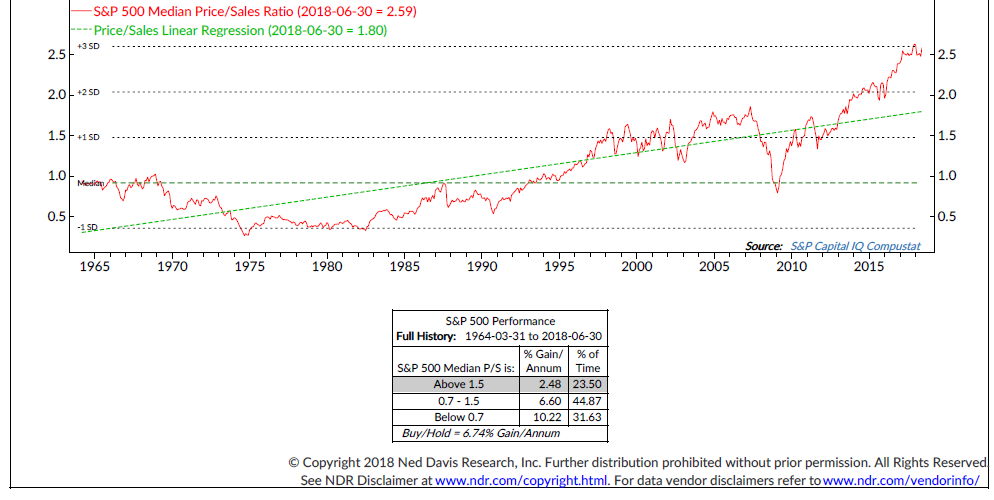
But in keeping with the spirit of this chapter, let’s assume this metric continues to stay up at peak levels indefinitely or maybe even go higher. In that regard, let me now re-run an even scarier chart but I’ll put a bullish twist on it.
S&P 500 VS. S&P 500 MEDIAN PRICE/SALES RATIO
 Source: Ned Davis Research
Here’s the bull spin: since the average price-to-sales ratio has only slightly exceeded past zeniths, why can’t it do what the median version has done and bust out to a new all-time high? Realize that the average price-to-sales ratio is capitalization-weighted, meaning the bigger companies have a much greater impact than the little guys. The fact that the median is so much higher than normal reflects the fact that smaller, lower quality, and much less profitable companies are far more expensively valued than the blue chips (as inflated as the latter are per the above chart on Boeing, et al). So, what’s to say the big guys can’t get the same valuation as their inferior S&P mates? Now, that’s a bullish argument I haven’t heard, but it’s not a bad one!
Let’s close this chapter with a montage of things that need to go right—allowing this bull to continue stomping for years to come—while also reflecting back on an October past that possessed some very eerie similarities to right now. Admittedly, there are just a few “IFs” that need to be satisfactorily resolved but, hey, just think about how many developments have broken the market’s way for years. So, along those hopeful lines:
IF this Fed tightening campaign (the first ever involving both rate hikes and quantitative tightening*) produces the fabled “soft-landing”, despite the reality that 10 of the 13 Fed-driven prior liquidity squeezes have ended in recessions and/or bear markets and…
IF corporate earnings can keep increasing at a rate far above the economy’s growth rate and…
IF an economy running at full employment can avoid producing uncomfortable inflation readings (which would prompt the Fed to tighten the screws even harder and faster) and…
IF weakness in overseas economies doesn’t feed back into the US and…
IF rapidly rising interest rates don’t create problems for a world that has added $108 trillion of debt since 2008—escalating the global debt-to-GDP ratio by a third since then--and…
IF the 90% of stock market trading activity that is controlled by computers and high-frequency trading continue to mostly buy rather than sell and…
IF the unprecedented reversal of multi-trillion dollar liquidity infusions into multi-trillion liquidity drainages by the world’s central banks doesn’t roil markets and…
IF US corporate profit margins can remain at their highest level ever despite rising labor transportation, energy, and import costs and…
IF this bull market can be the first ever to rise for more than nine consecutive years and…
IF the increasingly apparent breakdown in global housing markets that have, in many cases, risen well above what was considered the craziest levels ever 11 years ago doesn’t create a contagion affect and…
IF the intensifying crises in emerging stock, bond and currency markets doesn’t infect the developed world and…
IF Italy’s bond market—the planet’s third largest—doesn’t collapse as rates soar and fears of an “Italxit” mount and…
IF the trillion dollar plus market for floating rate junk bank loans doesn’t create widespread defaults as interest rates continue to soar and…
IF…ok, enough ifs. Let’s remember—and repeat after me—that bull markets climb walls of worry. Ergo, the higher the wall (or walls), the more bullish the implications.
But before you take too much solace from that happy thought, let’s think back to an October from 31 years ago. As today, a very pro-growth tax package had been passed the year before in the US. The American economy was roaring ahead at a 6% real (after inflation) rate. A pro-business president was in the White House. The Fed was tightening and the treasury bond market was reeling. The S&P was going vertical after years of a glorious bull market. Computerized trading and portfolio insurance were dominating activity on the NYSE. There were serious tensions between America and its primary trading partners, with tariffs slapped on certain Japanese products by a free-trader president. Currency markets were in turmoil (though, in that case, due to a too-weak rather than the current too-strong dollar). Stock valuations were worrisomely high (though not nearly as inflated as today, per the earlier charts).
As I wrote at the start of this chapter, it’s exceedingly difficult to experience more than a market correction when the US economy is not in recession. But that doesn’t mean a decline as large as 30% is impossible, it’s just rare. Like maybe a once-in-an-every-31-year type of rare.

David Hay
Chief Investment Office
To contact Dave, email:
dhay@evergreengavekal.com
OUR CURRENT LIKES AND DISLIKES
No changes this week.
LIKE *
* Some EVA readers have questioned why Evergreen has as many ‘Likes’ as it does in light of our concerns about severe overvaluation in most US stocks and growing evidence that Bubble 3.0 is deflating. Consequently, it’s important to point out that Evergreen has most of its clients at about one-half of their equity target.
NEUTRAL
DISLIKE
* Credit spreads are the difference between non-government bond interest rates and treasury yields.
** Due to recent weakness, certain BB issues look attractive.
DISCLOSURE: This material has been prepared or is distributed solely for informational purposes only and is not a solicitation or an offer to buy any security or instrument or to participate in any trading strategy. Any opinions, recommendations, and assumptions included in this presentation are based upon current market conditions, reflect our judgment as of the date of this presentation, and are subject to change. Past performance is no guarantee of future results. All investments involve risk including the loss of principal. All material presented is compiled from sources believed to be reliable, but accuracy cannot be guaranteed and Evergreen makes no representation as to its accuracy or completeness. Securities highlighted or discussed in this communication are mentioned for illustrative purposes only and are not a recommendation for these securities. Evergreen actively manages client portfolios and securities discussed in this communication may or may not be held in such portfolios at any given time.