
"Most great investments begin in discomfort…bargains are usually found among things that are controversial, that people are pessimistic about, and that have been performing badly of late."
- Howard Marks, one of the world’s finest money managers
Wild Woody. Curmudgeon. Bully. Hot head. Sore loser. Whiner. Winner. Those are all adjectives that could describe one of the most successful college football coaches of all-time: Wayne Woodrow "Woody" Hayes.
Both his fierce desire to win and his tendency to vent his frustrations by physically attacking players, officials, and even the media, eventually led to his career’s demise. The final blow—literally—came when he punched an opposing player at the 1978 Gator Bowl.
It was a sad end to a nearly 30-year stint at Ohio State University (OSU) where he won 5 national championships and 13 Big Ten titles. By all accounts, Woody was unusually erudite for a football coach as well as uncommonly interested in his athletes’ academic development, leading him to be referred to around campus as "Professor Hayes."
He also had a dry wit as evinced by his response to a reporter’s question about why he attempted a two-point conversion late in a game that OSU was leading 50-14 against arch-rival Michigan: "Because I couldn’t go for three."
Another of his memorable quips, and relevant to the theme of this month’s full-length EVA, related to one of his least favorite offensive tactics. When asked why his team didn’t throw the ball more, Woody famously replied: "There are only three things that can happen when you pass and two of them are bad." *
When it comes to the US stock market these days, I think Woody’s dim view of throwing the football is highly appropriate. Let’s consider the three things that can happen to stocks from here:
1. They can continue rising.
2. They can move into an extended trading range.
3. They can enter a bear market.
Superficially, it would seem that the first two of those outcomes would be good or at least tolerable, with only outcome 3 being viewed negatively. Further, I suspect that’s the order of preference in which most investors would place them. In my view, however, both items 1 and 3 are the turkeys.
Come again? How can a rising market be bad, for goodness sake? The answer is that there is such a thing as too much goodness. With the market as elevated as it is currently (more to follow on this shortly) an additional advance, particularly of any appreciable magnitude, would only accentuate the eventual "de-rating," as European professionals so politely refer to deep corrections and bear markets.
Even if you don’t buy the argument that the cure for high stock prices is high stock prices, let’s focus on the happier scenario for now…
The upside of going sideways. Recently, I had a lengthy conversation with one of Evergreen’s most economically savvy clients. His view is that bubble-inflators policymakers will move heaven and earth to prevent a major market decline. He believes that anytime the market hiccups, various Fed officials will be trotted out to assure the market that "never fear, the printing press is near." And certainly, as Tyler pointed out last week, the fact that one of the most hawkish Fed-heads did just that back in October, when the S&P 500 briefly flirted with correction territory, seems to validate that notion.
Consequently, our bright client believes US stocks will stay elevated and may continue to work higher for the next three years. If so, that would make this market truly a Methuselah at least in "bull years," as you can see from the chart shown on the next page.
*This quote may first have been uttered by former Texas coach Darrell Royal but even he attributed to Woody Hayes who certainly made it famous.
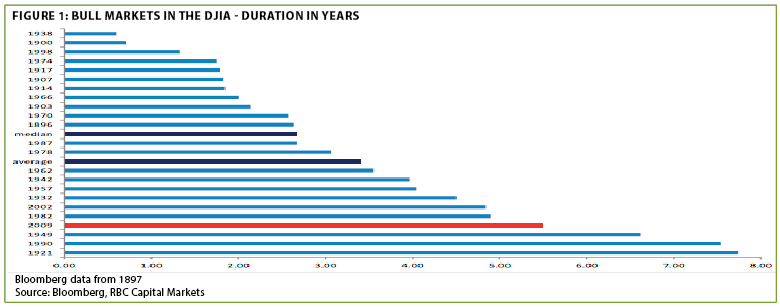
Someday, the bull market longevity record set back in the 1920s will be broken, and I suppose this one could do it, but it’s important to note that the Roaring Twenties romp began at much lower valuations than did the 2009 lift-off. The same is true for the extended bull runs that began in 1949 and 1990. And, of course, the epic 1920s streak didn’t end particularly well—except for short-sellers which reportedly included Joe Kennedy, JFK’s dad. (It’s intriguing that our client believes the ultimate decline, when this bull expires, will be worse than it was in 2008/2009, more along the lines of the 1929 –1932 obliteration.)
For my money, I continue to believe that technician extraordinaire Bob Farrell’s maxim about parabolic markets not correcting by going sideways will once again be affirmed. But it is possible that years and years of sideways movements, punctuated by controlled corrections and mild recoveries, could play out. This would allow earnings to catch up with stock prices which, during this expansion, have so greatly exceeded corporate profit improvements. On that point, you may be surprised to know that this has been the weakest earnings up-cycle in 55 years. Yet it has produced one of the most extravagant market rallies. Ergo, there is a whole lot of catching up to do when it comes to profits.
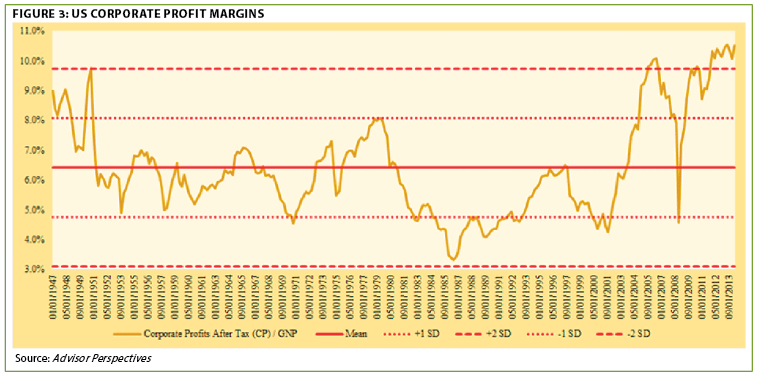
In order for the sideways scenario to unfold—with its implied avoidance of the type of extreme pain bear markets typically bring—it would likely entail profit margins staying at or close to their present record-setting levels. Certainly, that’s possible and they’ve already stayed up there longer than I felt realistic. But it’s stretching the laws of economics to make that assumption. Don’t take my word for it.
Consider what the Oracle of Omaha—none other than Warren E. Buffett—has to say on this score: "In my opinion, you have to be wildly optimistic to believe that corporate profits as a percent of GDP can, for any sustained period, hold much above 6%. One thing keeping the percentage down will be competition, which is alive and well."
Certainly, wild optimism is also alive and well these days. My, how far we’ve come from a few years ago.
Anatomy of a Blunder. Relentlessly rising markets create amnesia, in my experience. It wasn’t exactly eons ago that the prototypical affluent US investor was resolutely bearish on stocks and America’s future. Even as recently as the summer of 2012, and certainly during the panic in the summer of 2011, there was a profound sense of discomfort even with the bluest of blue chips of US stocks. I know because I repeatedly recommended them both in print and in various presentations at the time, at least in 2011, and the push-back was overwhelming.
Perhaps that should have been a big clue equities were ready to rip and they did, rising some 30% from the October, 2011, trough to the spring 2012 peak. This led me to believe a correction was overdue. In fact, a mild pull-back of nearly 10% did occur in the first half of 2012, creating, in hindsight, the last chance to buy up stocks at semi-reasonable valuations. But—and here’s the blunder—we didn’t pull the trigger.
My team and I were particularly worried at the time about the euro coming apart, precipitating a global financial crisis. Accordingly, our plan was to buy into the chaos that such an unraveling would almost certainly cause. Instead, Mario Draghi, the ECB’s new chief, turned the tide by simply vowing to "do whatever it takes to save the euro—and, believe me, it will be enough." As I’ve written before, I didn’t and it was—at least so far.
Even today, I’m amazed that mere words from Mr. Draghi produced such a powerful reaction. Only time will tell if he’ll be able to continue jawboning markets but color me skeptical—my favorite hue these days. (Admittedly, he’s also unveiled some lending programs that have greatly benefited financial markets, especially bonds, though they have done precious little to help Europe’s economy.)
Since then, various articles have been written, particularly a lengthy feature in The Financial Times, revealing how close a "Europlosion" actually was back in 2012. Regardless, it didn’t happen and that reality—combined with the Fed’s subsequent QE III—has propelled the US stock market to record levels even as many other asset classes have struggled mightily. It was, as the kids say, "my bad" for missing that chance to get up to our full stock allocation. (However, we continue to feel Europe is an IED ready to detonate at any moment and recent events in Greece indicate our continuing worries have some validity.)
Further, as many EVA readers realize, we are ardent believers in the predictive power of multi-year breakouts. Consequently, in the spring of last year, when the S&P 500 decisively broke above its prior resistance level (and all-time high) of 1565, that provided us another reason to become more fully invested.
Yet, in addition to break-outs, we also insist that a security needs to represent an attractive fundamental value which was not the case when the new high occurred. Looking at the S&P as if it was a stock, it was somewhat overvalued when it busted out. In other words, it was not even at fair value based on the various measures we use (with price-to-sales being our preferred metric). Obviously, in hindsight, that has not prevented the market from sprinting another 30%. Yet, as we all should know, markets often overshoot both on the upside and the downside.
On the topic of analyzing the S&P 500 as if it was a stock, I’ve previously noted the fact that the index’s overall earnings have become increasingly volatile since 2000. When that happens to an individual issue, it normally sells at a reduced multiple, or price/earnings ratio, to reflect the variability. That’s why cyclical stocks sell at lower P/Es than consistent growers.
Perhaps counter-intuitively, it’s a major investment faux paux to buy a cyclical stock at a low P/E because the "bargain" P/E generally means profits are close to a peak. But the truly cardinal sin is to buy a stock with volatile earnings at a high P/E toward the top of its earnings cycle. But that’s exactly what investors are doing right now by placing a very generous multiple on profits that, if Mr. Buffett is right, are far above normal.
But to return to one of my favorite piñatas, the real excess is with smaller companies. Not only are the earnings even more cyclical than they are with high grade issues (the S&P 500 is mostly a blue chip index) but their profit margins are, and always have been, about one-half of their large-cap brethren. Yet, as I’ve often commented, and as you can see below, they continue to trade at a material premium to the S&P.
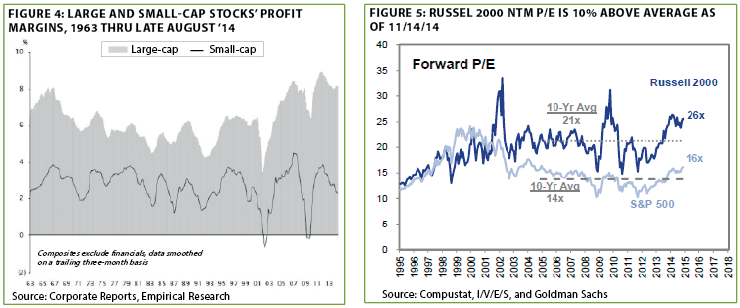
The question is—why? Yes, small caps have been beating blue chips for most of the past 15 years. However, a key driver of that out-performance was because they were ridiculously cheap on both an absolute and relative basis at the tail end of the late ‘90s uber-bubble in large cap growth stocks. Clearly, that is no longer the case. The argument that they are not as exposed to overseas weakness has some merit but that seems more than priced in; moreover, their domestic focus didn’t seem to hurt them during the global boom years from 2002 to 2007.
In my mind, it comes down to a classic case of investors chasing what’s been hot and taking it to an unjustifiable extreme. Also, please realize good reader, that this year, despite what could be another double-digit rise in the S&P, small caps have struggled. But they likely have a lot more heavy breathing ahead of them.
Now, let’s shift gears and talk about where some serious bargains have suddenly reappeared…
There has been blood—and a bloodbath! If anyone really needs a refresher on how quickly a boom can morph into a bust, you don’t have to look any further than the energy patch. You also don’t have to look any further back than this summer to a time when oil and gas issues were basking in glory. Not only were they star market performers—particularly the leaders of the shale oil revolution like Continental Resources—they were also shining symbols of American ingenuity triumphing over seemingly insurmountable technological and geological hurdles. This sector was also nearly the lone stellar performer in an otherwise listless recovery and, perhaps best of all, it had removed OPEC’s scimitar from our throats.
It could be the latter aspect which brought about the undoing of this latest energy boom. Saudi Arabia was clearly miffed at losing market control, causing them to launch a vicious price war of attrition. (Admittedly, they have other strategic objectives such as punishing both Russia and Iran.)
Regardless of the cause, or causes, the carnage among energy-related securities has been nothing short of appalling. In the case of the former shale darling, Continental, its stock has crashed from $81 in July to $33 this week. Now that’s a serious "re-rating"!
The selling has become so intense and wanton that even the relatively tranquil "toll-collectors" of the nation’s energy system—the MLPs (master limited partnerships)—have become collateral damage victims. A number of those are down 30% to 40% including one MLP that has almost no commodity price exposure and, consequently, highly stable cash flow. It also has a strong balance sheet, blue chip sponsors, and a large (still) market capitalization. At the price it fell to this week, it should yield nearly 7%.
Earlier in the year, this newsletter warned that MLPs were looking pricey. In fact, Evergreen reduced its MLP exposure for its clients to the lowest in years. But now we feel it’s clearly time to get out the checkbook again (though we’d caution it’s best to buy slowly given how much unsophisticated money flowed into this space in recent years). Prices could get truly "stupid cheap" should the liquidations accelerate, as they certainly could. But in a world of 1% to 2% interest rates on long-term government debt, bond-like MLPs (i.e., those with little commodity exposure and stable business models) paying 7% look extremely alluring.
Another area that has been mercilessly pounded is Canadian REITs. Our recommendation to buy into this space was certainly premature, but prices appear absurdly low with yields in the 8% to 9% range. It makes little sense for a REIT with a stable cash flow to be crushed because oil prices are down but, at least for US investors, much of the softness is due to the weaker Canadian dollar. As we have written before, there is a wayward belief that Canada’s economy is heavily reliant on the energy sector.
The weakness in both MLPs and Canadian REITs has opened a window to capture high cash flows in a world where yield is an increasingly endangered species. One of life’s recurring truisms is that there is opportunity in chaos. This is one of those times but I’m afraid most investors will miss the moment just as they did in 2011 and 2008/2009. On that score, it continues to amaze me how investors can’t tolerate falling prices even when yields are luscious. Imagine what will happen when low-, or no-, yield, speculative US stocks, like small cap, begin to crack in a big way.
Let’s wrap up this EVA by returning to Woody’s world…
For Whom the Whistle Blows. So what will it be? Up, down, or sideways for the US stock market? It’s my hope that we get the trading range outcome—the type of environment in which Evergreen has historically thrived. Those are so much less traumatic than the kind of ferocious bear market now descending on all things energy-related.
But my instincts and experience tell me such a benign outcome isn’t very likely, though I hope I’m wrong. I’m not going to torture readers with a bunch of data, as I have in the past, on why this is such a pricey market (ex-energy and other commodity-oriented issues). Rather, I’m going to give just a few very brief factoids and charts.
First, as the Financial Times’ John Authers recently observed, only the 1929 and 2000 markets were more highly valued on normalized earnings. (He also notes that overall earnings before interest, taxes, depreciation, and amortization—EBITDA—is lower than in 2007, meaning that non-operating factors have driven the profit surge). Second, US stocks once again make up 50% of total global stock market value, the same as in 1985. Yet, the rest of the world produces a far greater percentage of output than it did 30 years ago. Third, half of all stocks in the S&P 500 sell over 20 times what should be close to peak earnings. Blue chip stocks, especially, those in the energy and financial sectors, are suppressing the overall P/E.
Finally, on this topic, the charts on the next page are just a few visuals on which you might want to reflect.
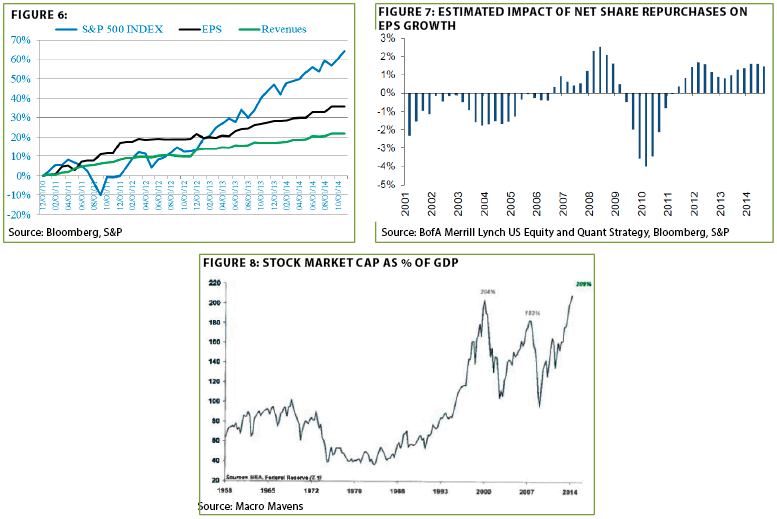
Figure 8 is particularly a favorite of mine because it compares the total market value of corporate equity- and debt-to-GDP (i.e.,for the professional EVA readers, total enterprise value). This reflects the added debt US companies have taken on to buy-back their own stock, at increasingly higher prices. Again, maybe this time is different, unlike the wipeouts that followed 2000 and 2007, but I sure don’t like those odds.
Recently, I came across a research piece titled: "Play Until the Whistle Blows." It urged investors to stay with the market echoing the advice of veteran strategists like Ned Davis who believe it is 40% overvalued but respect the upward momentum, as almost everyone does. In my case, though, that title brought back memories of former Citi CEO Chuck Prince’s now notorious words from the summer of 2007: "We have to dance until the music stops."
Woody Hayes’ teams were famous for their grit and fight. They certainly played hard until the whistle blew. Somehow, though, I think if Woody Hayes was reincarnated as a money manager today, he would be on record as saying that when two out of three possibilities are bad, he wouldn’t like the odds, either. Remember, despite his many faults, above all, Woody was a winner.

Important Disclosures
This report is for informational purposes only and does not constitute a solicitation or an offer to buy or sell any securities mentioned herein. This material has been prepared or is distributed solely for informational purposes only and is not a solicitation or an offer to buy any security or instrument or to participate in any trading strategy. All of the recommendations and assumptions included in this presentation are based upon current market conditions as of the date of this presentation and are subject to change. Past performance is no guarantee of future results. All investments involve risk including the loss of principal. All material presented is compiled from sources believed to be reliable, but accuracy cannot be guaranteed. Information contained in this report has been obtained from sources believed to be reliable, Evergreen Capital Management LLC makes no representation as to its accuracy or completeness, except with respect to the Disclosure Section of the report. Any opinions expressed herein reflect our judgment as of the date of the materials and are subject to change without notice. The securities discussed in this report may not be suitable for all investors and are not intended as recommendations of particular securities, financial instruments or strategies to particular clients. Investors must make their own investment decisions based on their financial situations and investment objectives.