
“Once the Fed starts a tightening cycle, it is very difficult to avoid a recession before it is over.”
– Veteran money manager, James Stack
“The herd instinct among forecasters makes sheep look like independent thinkers.”
–Edgar Fiedler, author of the “The Three Rs of Economic Forecasting—Irrational, Irrelevant and Irreverent
______________________________________________________________________________________________________
Finally! A “Bubble 3.0” chapter mostly devoted to the stock market! Based on what a complex beast it is, the fact of the matter is there are myriad factors that come into play as to which direction it’s heading. Further, because this is such a vital and controversial subject, we are doing a two-part edition with the second installment coming out a week from today so that we can properly evaluate the various forces impacting stock prices now and into 2020. The latter promises to be a pivotal year not only for stocks but the economy at large.
Certainly, it’s been fashionable to stay bullish on US stocks no matter what level of craziness is afflicting the world these days. Yet, that style may be going out of fashion as the undeniable reality is that even the mighty S&P 500 has basically flat-lined since mid-January of last year.
In our June 14th, EVA, “A Blast From A Bubble Past”, the similarities between market conditions in early 2000 and the recent behavior of the US stock market were detailed. For those readers that don’t want to go back and read that chapter of our never-ending ongoing “Bubble 3.0” series, a book being published in real-time, suffice to say there is a long list of parallels.
This is actually good news because if it is a replay of that era, there are considerable profits to be earned in stocks over the next few years. But—and it’s a big one—if so, it’s essential to be heavily exposed to the neglected tier of what we’ve been calling, since late last year, a two-tier market. This is a point we’ve made several times but, if Evergreen is right, it’s a view worth emphasizing and defending.
Here’s another "but", and a much less pleasant one: If the world is entering an actual recession—one that includes the US and, especially, a downturn that imperils our consumer credit card culture—the required investment strategy is much different. This is because we would likely be looking at a scenario far more like 2007 than 2000. In that case, there will be almost no place to hide in the equity markets, as was the case in 2008.
A key reason the US stock market has enjoyed its longest bull run ever is because our economy has also had its longest expansion ever. Market history is clear that severe bear markets—which also means the prior bull market is dead and gone—coincide with economic contractions. In other words, a big plunge nearly always needs to be caused by something far worse than a growth pause such as we saw in 2015. You may have repeatedly read and heard this is the outcome for which many a dyed-in-the-wool bull fervently prays. Of course, earlier in the year they wouldn’t even concede that growth was set to decelerate. As usual, estimates were for another robust increase in corporate earnings on the heels of last year’s tax-cut fueled burst.
As 2019 has unfolded, though, it’s become clear that not only will there be no S&P profit expansion but another earning recession looks almost inevitable. The bulls will glom on to the fact that 2015 also saw an earnings recession (commonly defined as two consecutive quarters of falling profits) but it wasn’t enough to produce an official recession or a bear market. Rather, two brief but scary 15% corrections (the second in early 2016) were all that investors had to endure. The brevity was especially fortuitous because most investors didn’t have enough time to become discouraged and push the ejection button as far too many folks tend to do during long and grueling bear markets. So fleeting were these squalls that the US stock market actually rose during the 2015 earnings swoon.
The same transitory aspect was also the case with last year’s two pullbacks. The first began in January and the second, much more serious conniption fit, started right before we published our “What Could Go Right” Bubble 3.0 EVA last October which culminated in the Christmas Eve mini-panic. That 3-month long period of tumult brought stocks within a hair’s breadth of the greater than 20% tumble that is considered an actual bear market.
Consequently, it’s probable that the reason that both the 2015 and 2018 market shakeouts were relatively mild and short-lived is because an actual recession was avoided. Thus, as stocks once again are wobbling, after a powerful rally coming out of the Christmas chaos (one that we anticipated in our January 4th, 2019 EVA), it’s worth considering the odds that the most extended expansion ever is ready for the morgue. If not, recent weakness isn’t likely to morph into something much more ursine, like a real bear market (it seems as though few remember those and even fewer believe one could be imminent).
The yield curve inversion we warned about as long ago as our July 6, 2018, EVA, when we wrote that “With five more rate hikes scheduled, the curve is almost certain to invert,” is fully upon us. By invert, we were referring to that odd situation when short rates move above longer rates and it’s no exaggeration to say anticipating the inversion was a very lonely position during the summer of last year. Over the last 14 months, though, this classic late-cycle condition has spread from a few isolated parts of the treasury market into a full-blown and deep inversion.
Yet, I can’t tell you how many articles and essays I’ve read basically saying this time is different, including some from our partners at Gavekal. Frankly, I’ve lost count, but I haven’t forgotten that there were also a plethora of similar dismissals that came out back in 2007, the last time the curve went upside-down. Obviously, the curve turned out to be right twelve years ago and the many pundits who blew it off were not just wrong but embarrassingly wrong (though they’re at it again, displaying a remarkable case of collective amnesia).
To be fair, though, there really is a big and obvious difference this time: The mind-blowing amounts of pseudo-money that central banks have created to buy up government bonds and drive yields down to levels never before seen. Yet, the US yield curve inversion has happened at a time when the Fed has been, until very recently, actually reversing its massive “print and purchase” program, a process known as QT or Quantitative Tightening. Moreover, when almost all the experts are saying not to worry, I get very worried indeed. Please recall that the majority of Wall Street economists and strategists have managed to miss every recession of the post-war era.
In the aforementioned July, 2018, EVA—which involved another “pseudo”, as in an imagined interview between a fictitious CNBC personality and yours truly—I stated the Evergreen view at the time was that the 10-year treasury might briefly get as high as 4%, temporarily steepening the yield curve. (I.E., this would briefly reverse the inversion process). When I was asked “Why temporarily?” I replied: “Because with all the debt the world has taken on—$70 trillion over the last dozen years or so—my firm believes the system can’t tolerate rates that high…anything close to 4% on the 10-year (T-note) is likely to create serious problems for overleveraged companies and may well trigger the next financial panic. If so, the 10-year yield will plunge perhaps below 2%, creating a severely inverted yield curve if the Fed has hiked even two more times by then.”
As we all now know, it only took a 10-year rate of 3 ¼% to produce serious market turmoil both in the US and, especially, overseas. After initially talking tough and projecting a series of additional rate hikes this year, Fed chairman Jay Powell did a blink worthy of Nikita Kruschev during the Cuban Missile Crisis. Not only did the Fed stop raising rates, they cut this July. And here we are, already below 2% on the 10-year treasury—way below, like 1 ½%. In fact, we are only a twenty or so “bips” (basis points or hundreds of a percentage points) away from an all-time low in the 10-year T-Note. Incredibly, that has happened even though the US economy is not yet in recession, at least officially. And, of course, the yield curve is indeed “severely inverted”.
But the truly multi-trillion-dollar questions are did they tighten too much last year, as President Trump continues to rant assert, and did they wait too long to cut? The answer may well be yes to both. If so, then the US is in store for a lot more than a growth slowdown à la 2015. Already it appears as if both another earnings recession and an industrial contraction are unfolding. (Reinforcing the latter point, this week’s release of a very soft Purchasing Manager Index also revealed New Export Orders at the lowest level since the Great Recession. ).
In fact, the August 30th, issue of the Wall Street Journal noted that profits dropped in both the fourth quarter of last year and the first quarter of this year; thus, a mild profits recession has already happened. It also looks nearly certain that the second quarter number also had a minus sign in front of it. Encouragingly, profits’ recessions occurred not only in 2015 but also in 2001 without triggering a consumer recession. However, the S&P 500 reaction was vastly different in those two episodes. As described above, four years ago the market pain was transitory and comparatively light. From 2000 to 2002, though, the S&P was cut in half and the even more popular NASDAQ performed a nearly 80% face-plant.
Consequently, it’s possible that we could have an extremely serious market shake-out even if the US avoids a consumer recession. Interestingly, one glaring difference between 2001 and 2015 was that the yield curve had inverted prior to the former instance but not in the latter case (2015). However, as we noted, in our “A Blast From a Bubble Past” EVA, while a vicious bear market was raging in tech stocks in 2001, a delightful bull market was happening in almost all other stocks, particularly those considered “value” and “old economy” issues. The problem was back then, nearly everyone was heavily invested in tech and other growth plays and were underexposed to the deeply out-of-favor value sectors like financials and energy. Does that ring a bell? If not, the below chart might help escort you down memory lane.
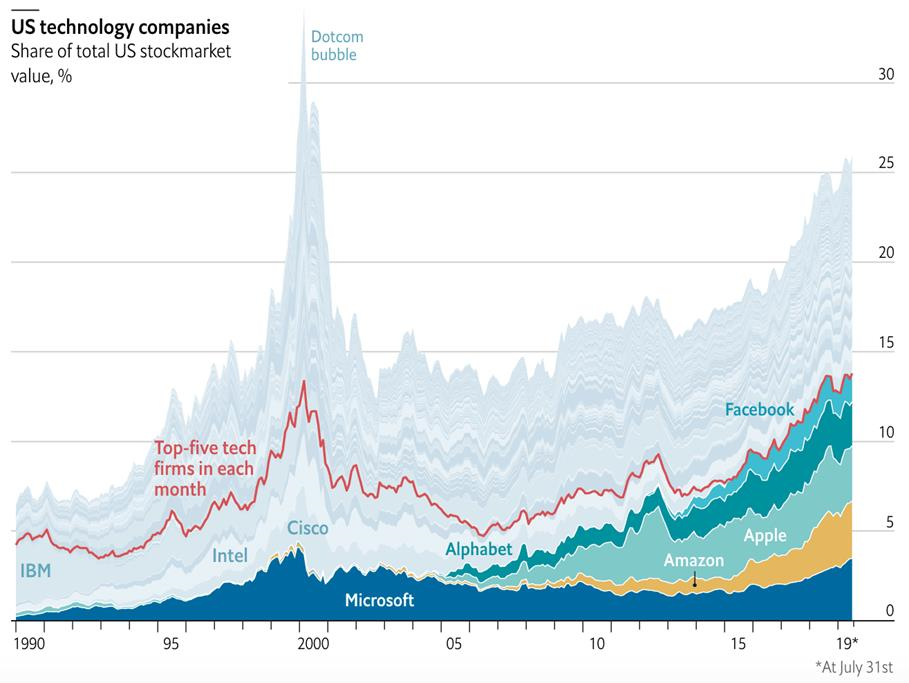
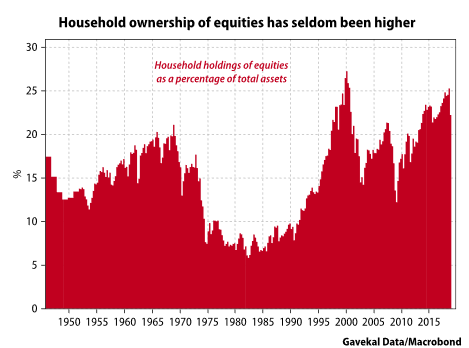
It also took a rather long time, like almost a decade and a half, to recover from that market thrashing—and that was in the S&P 500, at least on an inflation-adjusted basis. As you can also see, US households are almost as exposed to stocks as they were prior to that market disaster.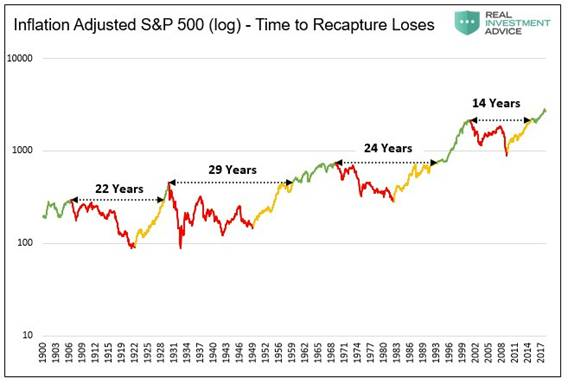
Rob Arnott is as smart as they come. He’s the founder of Research Affiliates and the creator of a market index process that mitigates many of the problems with the typical market capitalization-based benchmarks (i.e., one that simply tracks companies by their stock market value as the S&P 500 does). There is now $184 billion tracking his creations. Rob was interviewed last month by Barron’s and here are a couple of short, but informative, excerpts:
Barron’s: “You’ve just updated your scatter plot of expected returns. What’s the biggest surprise for most people?”
Rob Arnott: “That what has performed best in the past isn’t likely to perform well in the future, and what has disappointed in the past is where the opportunities lie…(investors) think that because they’ve earned double-digit returns in the past decade, and 9% returns on average over the past 100 years, those 9% or 10% returns are a perfectly reasonable expectation. That’s not true. Part of the lofty returns of the past was rising valuation multiples. The market was getting more expensive. If anything, rising valuations tend to mean-revert. They presage lower future returns, not higher.”
How much lower you might ask? Well, here’s a table from his firm that accompanied this interview. Two and a half percent before inflation and just one-half percent after it (i.e., real), with all the risk stock ownership implies, certainly qualifies as low in my book.
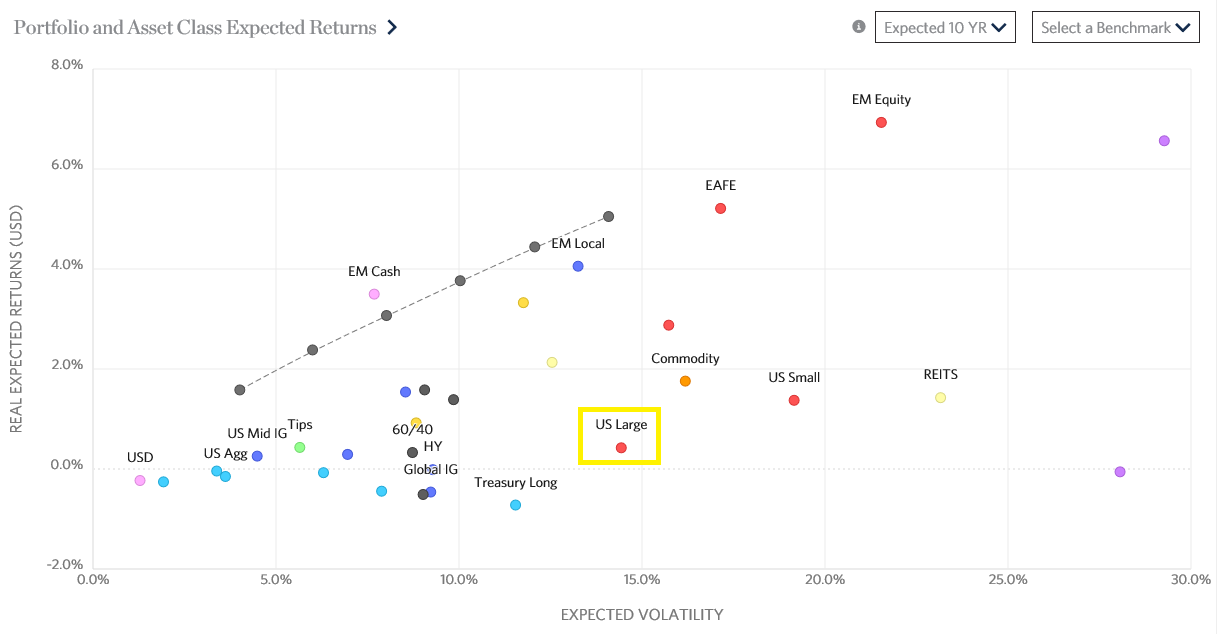
Source: Research Affiliates
My only quibble with this article is that toward the end Rob opines that the US stock market is not in a bubble. Based on Evergreen's two-tier market thesis, though, it’s not a major opinion divergence since, clearly, high-quality stocks trading at 12 times earnings or less, which are, once again, increasingly common, does not imply a complete market bubble. But the valuations of most small cap stocks and a raft of supposedly high-growth issues--at least until they disappoint, as most likely will--definitely is déjà vu 2000 all over again. In fact, since the Wilshire 5000 index is heavily populated by smaller companies, many of which fit the sexy growth profile, conditions look far bubblier than they did even during the craziest days of the late 1990s.

It's been a long while since I specifically assailed the valuations of small companies, but the forgoing provides an excellent lead-in for an update. For years, Evergreen has not been big on small caps, to say the least. Our basic premise has been these entities consistently have profit margins and returns on capital about half of their larger brethren. They also tend to have weaker balance sheets.
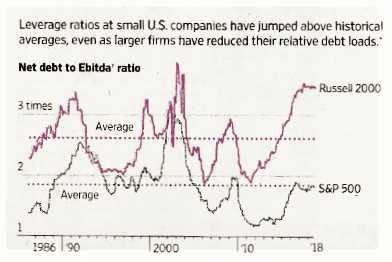
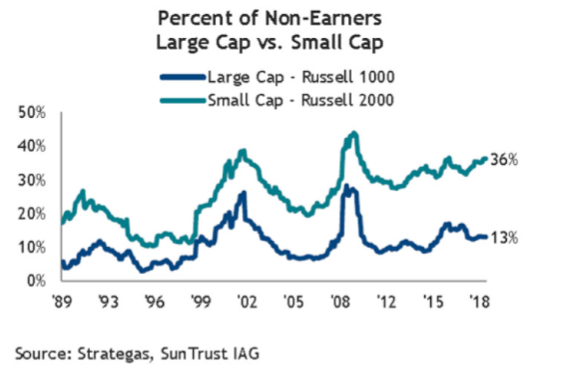
Despite this reality—and the fact that over one-third of the Russell 2000 small cap index loses money—they have been trading at a sizable premium (i.e. higher P/E ratio) than the blue-chip laden S&P 500. This is even excluding the money-losers which, if they were included, would dramatically raise the small cap P/E. (By the way, S&P runs a small cap index, the S&P 600, which has a far superior composition; thus, our negativity is primarily directed at the Russell 2000. We further acknowledge that the small cap universe is made up of thousands of companies and even today many of those appear undervalued, some extremely so.)
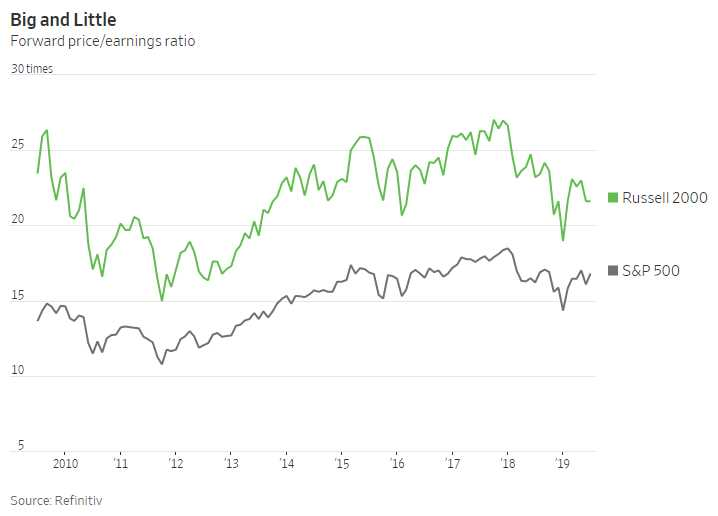
Source: Wall Street Journal, July 23, 2019
To be fair, small caps have risen since 2014 when we became highly critical of their stretched-like-spandex-on-a-Sumo-wrestler valuations. However, the Russell 2000 has returned just 30.2% versus the S&P 500’s 55.1%. Despite this lag, though, small caps continue to reside in valuation La-La Land, as do their earnings estimates. Small cap bulls will point out that earnings growth for them is estimated to be 20% this year. However, this still equates to a P/E over 20. Clearly, someone forgot to tell small cap enthusiasts about the earnings recession. When it comes to next year, an even more outrageous 30% growth rate is assumed, causing the bulls to say their “faves” are a steal at only 15 times future profits. But those earnings have about as much chance of happening as the Seattle Mariners do of making this year’s playoffs.
History is clear that small caps fare much worse during recessions than the big blues. Based on how trashy smaller company balance sheets are presently, the carnage could truly be brutal. They also are more exposed to rising wage pressures and this may be a prime factor in the big profits revision I will highlight next week. These are likely at least partial explanatory factors for why small caps are down -15.74% from their highs vs only -4.1% for the S&P 500. Consequently, we believe hedging long exposure with small caps remains reasonable (Evergreen did close out most of its clients’ small cap short positions during the late 2018 crashette).
That’s it for this installment of our “Bubble 3.0” chapter on the stock market. Next week I'll home in on the odds of a recession which is definitely a flash-back to 2007. We’ll have more data on the economy by then, giving us perhaps a bit more clarity. But, for now, the skies are definitely beginning to darken, despite some residual rays of sunshine. Let’s hope we’re not looking at the economic equivalent of Hurricane Dorian. One of those this century was definitely more than enough.

David Hay
Chief Investment Officer
To contact Dave, email:
dhay@evergreengavekal.com
DISCLOSURE: This material has been prepared or is distributed solely for informational purposes only and is not a solicitation or an offer to buy any security or instrument or to participate in any trading strategy. Any opinions, recommendations, and assumptions included in this presentation are based upon current market conditions, reflect our judgment as of the date of this presentation, and are subject to change. Past performance is no guarantee of future results. All investments involve risk including the loss of principal. All material presented is compiled from sources believed to be reliable, but accuracy cannot be guaranteed and Evergreen makes no representation as to its accuracy or completeness. Securities highlighted or discussed in this communication are mentioned for illustrative purposes only and are not a recommendation for these securities. Evergreen actively manages client portfolios and securities discussed in this communication may or may not be held in such portfolios at any given time.