
“Bubbles are normally a good idea taken way too far.”
– Gerard Minack, frequent Guest EVA source
“Instead of judging the market price by established standards of value, the new era based its standards of value upon the market price. Hence, all upper limits disappeared, not only upon the price at which a stock could sell, but even upon the price at which it deserved to sell.”
– Benjamin Graham and David Dodd in their classic investment book, “Security Analysis” published in 1934, referring to the late 1920s stock bubble. (Graham would later teach and inspire a young Warren Buffett.)
______________________________________________________________________________________________________
Disclosure: Securities highlighted or discussed in this communication are mentioned for illustrative purposes only and are not a recommendation for these securities. Evergreen actively manages client portfolios and securities discussed in this communication may or may not be held in such portfolios at any given time. Please see important disclosures following this piece.
Alan Greenspan attracted considerable scorn back in late 1996. This was when he warned, as a few old-timers like me may recall, that the US stock market was caught up in what he called: “irrational exuberance”. Over the next three and a half years, things got a whole lot more irrational. By that time, the former Fed maestro had caved to the euphoria and was, like most people, rationalizing valuations that were in the process of exceeding their 1929 zenith.
The fact of the matter is that there was enormous, unprecedented wealth created in the late 1990s. The internet had just gone mainstream and companies like Amazon were destined to make their investors wealthy beyond comprehension…if they were able to hold on, that is.
As I previously, and embarrassingly, have admitted, I could have been a billionaire had I followed my former almost-partner’s advice to invest in Amazon, as he did, when it was founded in an old rental house a few blocks from our home at the time. But, then again, if I had then I would have become what Bernie Sanders’ team has called a “policy mistake”. Geez, I sure don’t want that on my tombstone!
The key to benefiting from the tech bubble of twenty plus years ago, of course, was getting in early, taking profits on the rocket ride that peaked in early 2000, and then hanging on through the horrific tech crash. In the case of my almost-Amazon experience, buying more with money pulled out by selling as the tech bubble was inflating to unparalleled proportions, would have generated another billion or two for yours truly. However, whether it was with Amazon, Microsoft, Dell, EMC or whatever the shooting stars were, most people did exactly the opposite.
As Amazon and its tech-mates went vertical, millions of investors worldwide poured ever increasing sums into them. Worse, they also went hog wild over companies that had nowhere near the staying power of the Seattle e-commerce goliath. There were a plethora of cover stories in that giddy era similar to the following.

Source: Time Magazine, September 27th, 1999
Most of these tech darlings would spectacularly flame out, destroying wealth at a rate not seen since the early 1930s. Even destined-to-be-mighty Amazon had a near-death experience during the worst of the tech-wreck, during which the NASDAQ fell nearly 80% by the summer of 2002.
Trust me on this: In early 2000, it was inconceivable to tech investors, who had ridden the “NAZ” to stunning gains over the prior five years, that they would end up losing money in a few short years. Yet, for the legions of them who had bought at an accelerating clip on the way up, the losses were so severe as to force large numbers who were retired back into the work force. The sad stories were as numerous as their losses.
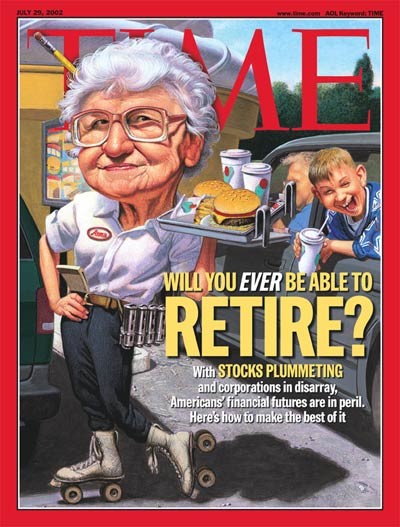
Source: Time Magazine, July 29th, 2002
At the peak of the tech madness in early 2000, the NASDAQ had produced a 509% cumulative return from 1/1/95, or an incredible 42%, compounded, per annum. By, October of 2002, at the NASDAQ nadir, the per year return was down to 5.2%. Now, one could say, that’s not bad but, as we shall see, 5% was much, much higher than what most investors realized due to the aforementioned persistent and increased buying as prices soared.
It’s this recurring tendency to chase markets that have already gone postal that plagues most retail investors and even many professionals. The latter should definitely know better but they are often under extreme pressure to keep up with whatever the hot index is, a reality that is playing out with great intensity once again. It’s just a fact that inflating markets or sectors into true bubble dimensions requires an acceleration of late-stage in-flows by hordes of performance-chasers. That is also a phenomenon we are seeing today in a wide variety of markets, including the most important sector on the planet earth right now. (Any guesses on that one? We’ll get to it soon.)
For veteran EVA readers, I realize this is familiar ground and I apologize. However, based on the extraordinary number of crazy things happening in what may be the craziest time the world has experienced since WWII, I believe it’s time to review first principles. And, in my book, there is no principle more important than recognizing and avoiding the mass hysteria of bubbles.
As I wrote these words, I literally shook my head at the incongruity of authoring a piece like this just mere months after the March implosion. Never before in market history have we gone from boom to bust to boom again at such hypersonic speed. Yet, here we are. Charles Schwab just reported that it opened 1.65 million new retail brokerage accounts in the second quarter, more than triple the prior year number. Additionally, it said trading volumes have increased by 126% versus last year.
Recent EVAs have noted the latest speculative craze involving stocks that have filed for bankruptcy or were on the verge of doing so. Many have pointed out how well these have done, at least before reality sunk its wealth-devouring teeth into the bull stories, deeply flawed as they have been. Most simply have looked at the price charts which tell a sorry enough tale of the unhappy marriage of stupidity and greed.
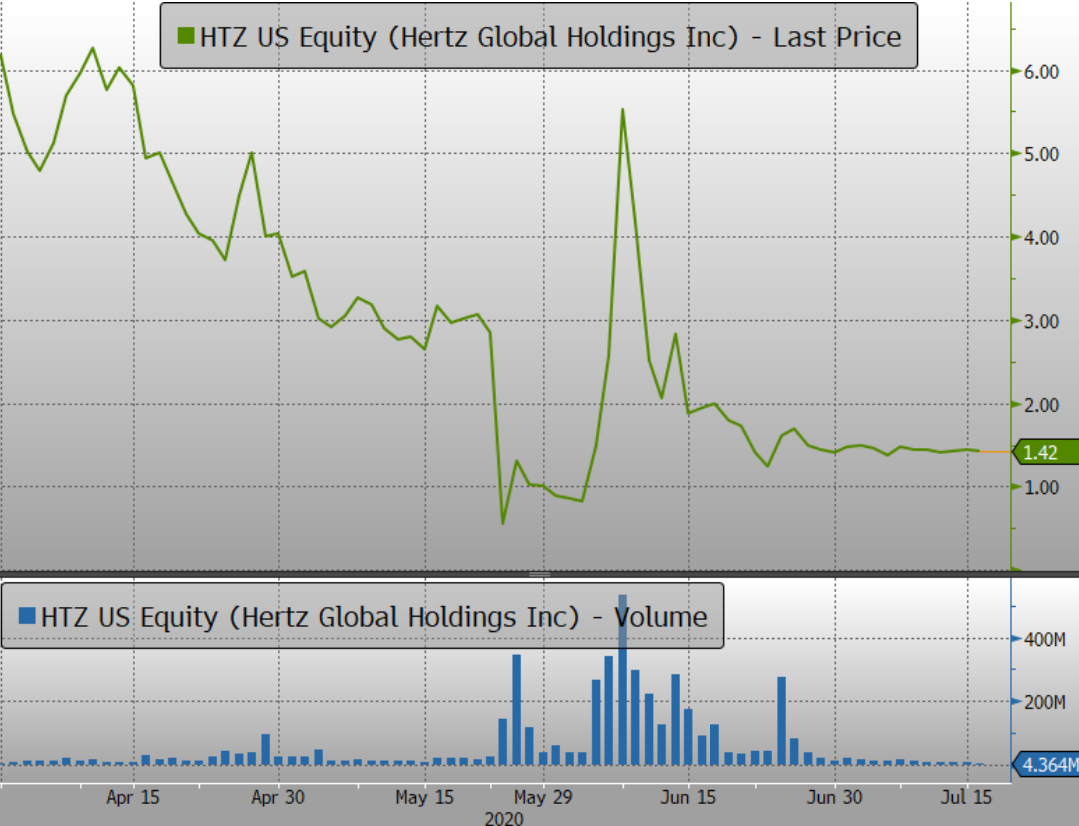
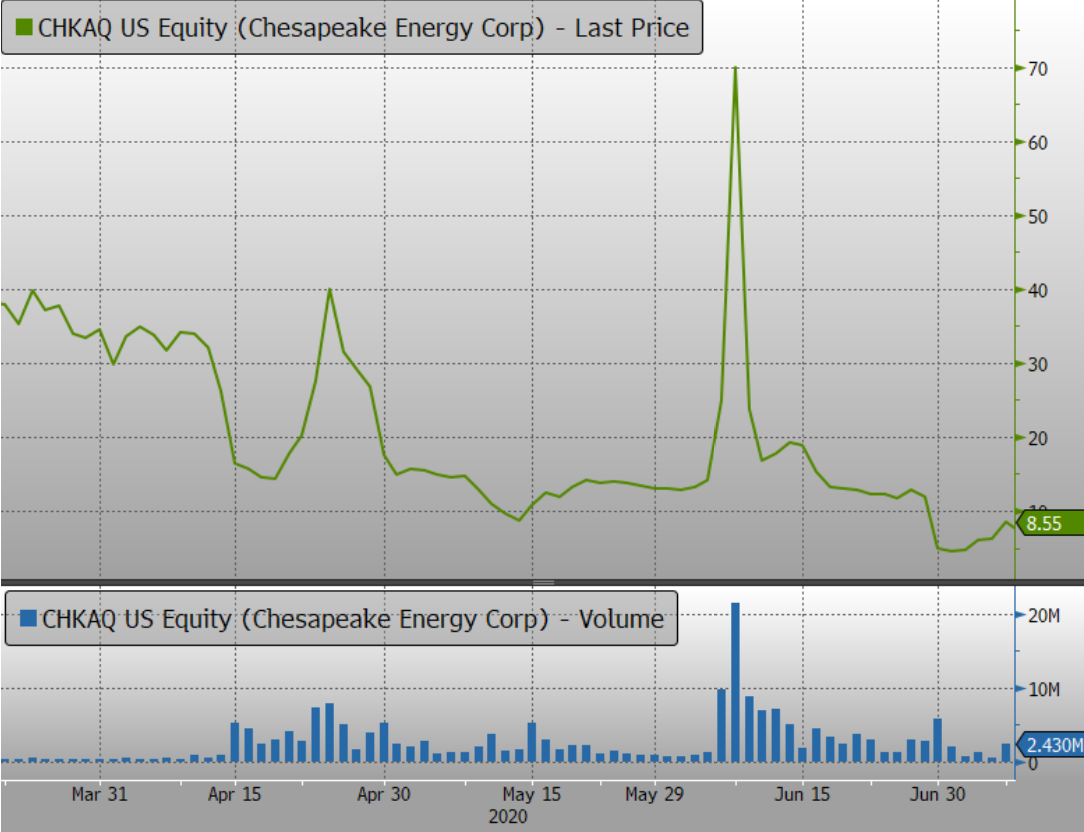
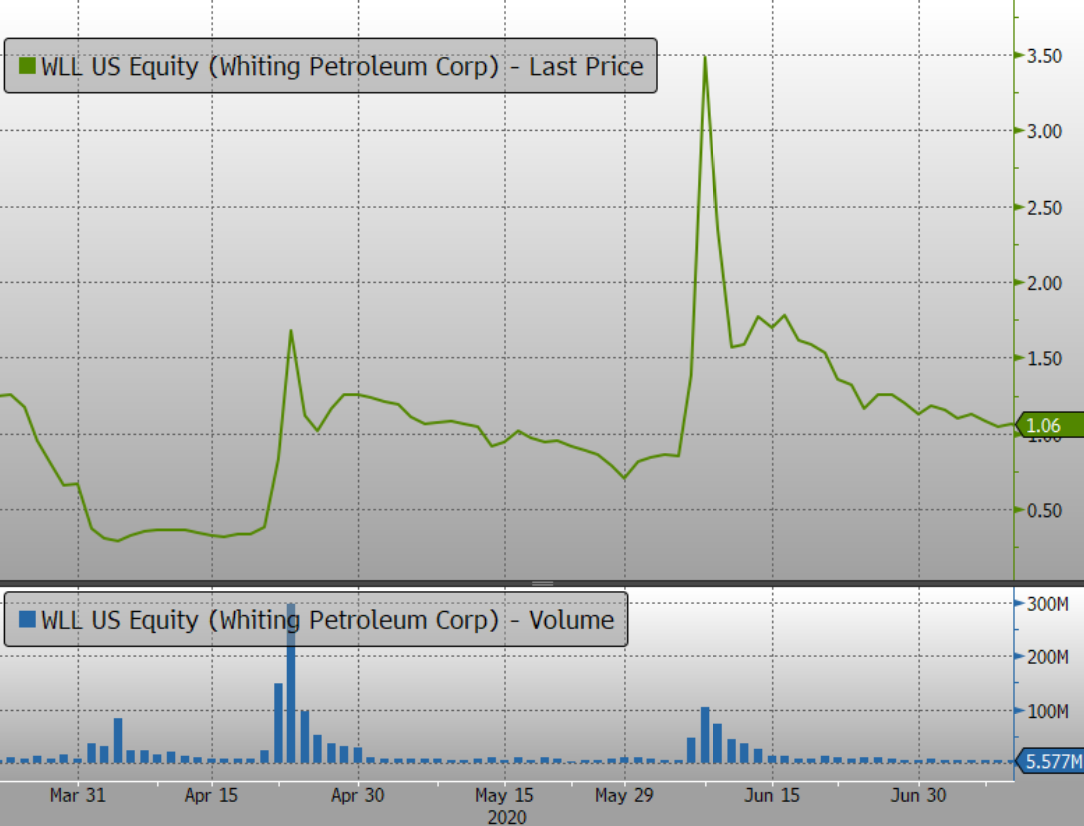
Source: Bloomberg, Evergreen Gavekal
Notice from the preceding charts that volumes were low before the lift-off occurred and then how they swelled in each case as the busted stock rode up the price hockey stick. What that tells you is that there was a lot of wealth destroyed in each of these situations. (It’s nearly certain that the heavy volume on the sell-side was coming from those who had bought in at lower prices, at least until the latecomers began to frantically bail, as the trap door suddenly opened.) The more things change, the more they remain the same. (As an aside, those who played this foolhardy game with bankrupt JC Penny stock are now petitioning the courts for compensation. Good luck on that one!)
These pages have repeatedly recalled our warnings about Bitcoin during its most maniacal phase in late 2017 so I won’t rehash that other than to say the same situation happened with it, arguably (but not very) the most audacious bubble in human history. The massive volume in Bitcon Bitcoin and the other cryptos happened very close to the maximum inflation point. As with the banko stocks, you can be assured that most of the smart money was selling into the massive influx of fad-chasing “investors”.
The same was true with the now-infamous, though increasingly forgotten, tech bubble. As you can see below, in-flows into tech funds went as nuts as the dot.com stocks themselves did, which makes sense since all bubbles need helium. In markets, that’s money…and of the very greedy variety.
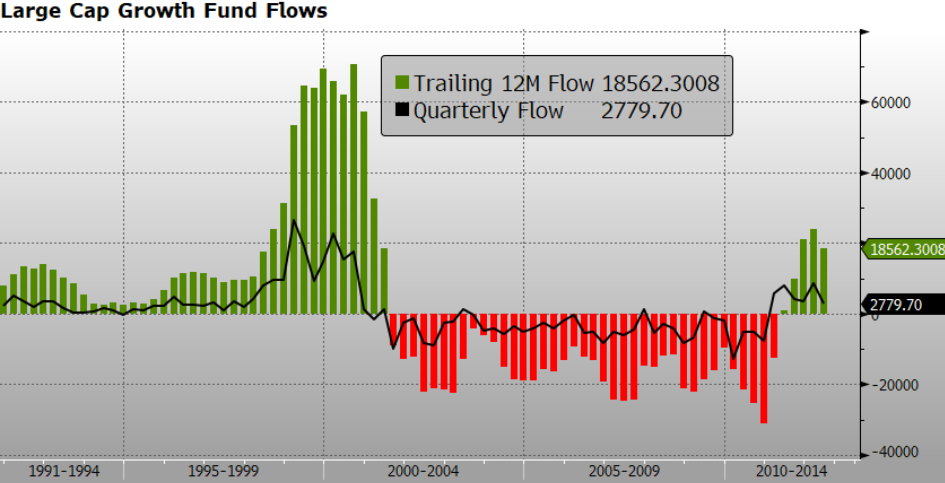
Source: Bloomberg, Evergreen Gavekal
Note also that once tech stocks were crushed, the money flows reversed course. Tech stocks became radioactive and detested. They stayed that way for years, even as growth issues, which are heavily represented by tech issues, began their long revival.
It was during this time that Evergreen decided to unveil a new investment strategy called Right Cycle Investing. The premise was, and is, that most investors play the cycles wrong, as I’ve just shown. They are masters at buying high and selling low and they just keep doing it over and over. If you think I’m exaggerating, please check out this bar chart from a recent JP Morgan publication.
Source: JP Morgan
Interestingly, our Right Cycle system of positioning contrary to what the most hyperactive mutual fund investors were doing (i.e, those who generate most of the flows) caused us to overweight Large Cap Growth stocks in 2004. It hurt for the first couple of years as they continued to lag (and, believe me, a couple of years seems like an eternity in the financial markets). However, since then it has been a winning position. Incredibly, as our Likes/Dislikes section has indicated for as long as we’ve published it, Large Cap Growth has stayed in the most-favored position. (Full disclosure: Due to market valuation concerns, Evergreen prematurely moved to an equity underweight position though we’ve also aggressively bought into the declines, particularly in March of this year.)
Frankly, I never dreamed an asset class or major style, like Large Cap Growth, could remain a buy in our Right Cycle system for over 15 years. Further, I’ll admit I am extremely nervous about this space right now. Once again, I’ll use a chart to illustrate why I’m so concerned. (The NASDAQ 100 is heavily comprised of large cap growth stocks, mostly tech.)

Source: Bloomberg, SENTIMENTRADER
Ironically, it has been the virus crisis that has elevated big tech to almost unimaginable heights. Companies like my missed billionaire opportunity, as well as the other so-called FANG* stocks, are perceived as immune to the COVID-caused economic apocalypse, even beneficiaries of it; based on the resilience of their business models through the pandemic, that’s not an unreasonable conclusion.
But—and this a whopper “but”—valuations in FANG-land are becoming increasingly 1999-like. One day last week, Amazon rose by 6%. You might think that’s unremarkable since stocks often swing up or down that much in a day. But when a company has a $1.5 trillion market cap, as my old whiff does, that amounts to nearly $100 billion. Think about that for a minute—AMZN added the value of a Boeing in a mere 24 hours. (On a related note, Jeff Bezos and his soon to be ex-wife, Mackenzie, made a rather punchy $22 billion last week which means I would have made…oh, never mind!)
For 2020 as a whole, AMZN’s market value has increased by $550 billion to a capitalization (aka, market cap) of $1.5 trillion, a 60% increase in a bit over half a year. Moreover, it wasn’t exactly at a chintzy valuation at the end of last year. Not that long ago, the thought of a trillion-dollar market cap in a single company seemed outlandish.
Unquestionably, AMZN has posted exceptional sales growth over the past five years and through the COVID crisis. But a $1.1 trillion dollar market value increase since 2015 compared to a $15 billion increase in earnings seems a tad disproportionate. Let’s look at another FANGM constituent, however, for what might be an even more astounding divergence between profits and valuation.
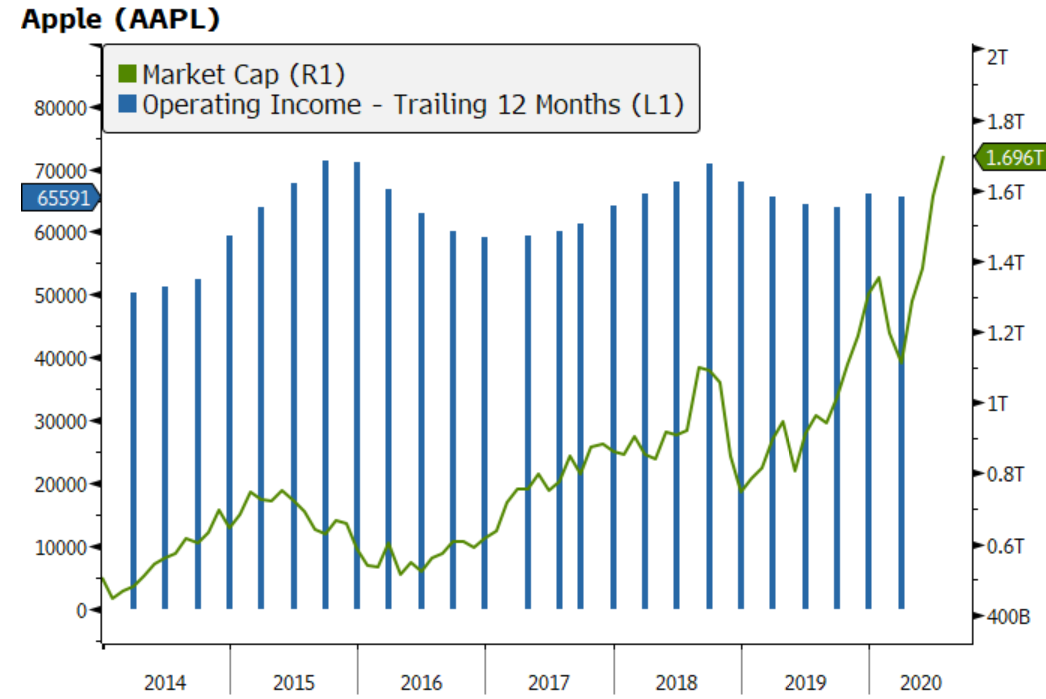
Apple’s market cap is actually slightly higher than AMZN’s, knocking on the door of $1.7 trillion. This is an increase of $1.2 trillion over the last five years. Again, when Apple was valued at $500 billion in 2015, many, including yours truly, were skeptical it could ever hit $1 trillion, even over a five-year period. Clearly, I greatly underestimated Forrest Gump’s favorite fruit company. (I wish I’d asked Captain Dan what he thought about investing in Amazon back in 1994!)
The even more fascinating part of this is what Apple’s operating earnings have done over this timeframe. As you can see in the chart below, the answer would be not much.
*It’s actually more like FANGM (Facebook, Amazon, Netflix, Google, Microsoft) based on the outstanding performance of the latter which was considered a no-growth stock for years, as I painfully remember.
Source: Bloomberg, Evergreen Gavekal
Note, however, that I’m referring to the profits generated by Apple’s actual business lines. If you use earnings per share, it’s been a more impressive, though not stunning, story. Apple’s profits per share have risen by 29%, or 6.6% annually since 2015. For those unfamiliar with what is called financial engineering, this is a classic example. Apple has used its abundant free cash flow (i.e., cash flow in excess of capital expenditures), plus borrowed funds, to buy back its shares in enormous quantities. Meanwhile, net income overall (so, not on a per share basis) has only bumped up by 3.5%, or 0.9% per year.
It’s most reasonable to ask, I think, is a $1.2 trillion market cap surge justified by flat earnings from operations over a five-year period? It’s also fair to question if Apple is still the exciting consumer tech innovator it was in the Steve Jobs glory days. Certainly, Tim Cook has been a competent steward and he’s grown the services business, with its delicious stream of predictable and swelling cash flow, admirably. But flat operating earnings despite that means the rest of Apple must be contracting.
Evergreen owns both AMZN and AAPL. Thus, we get the bull side of their stories. But we are taking profits in some of our strategies on them. Maybe they’ll both hit $2 trillion soon, but that’s ok. We’ll still be holders, though at less than their weights in the S&P 500. (An important aside is that most of the younger members of Evergreen’s investment team are far less concerned about mega-cap tech’s valuations than I am.)
Looping back to the opening Alan Greenspan “irrational exuberance” story, Tesla is another fascinating case study in far too early warnings and astronomical valuations. On May 1st, Tesla’s CEO Elon Musk tweeted: “Tesla stock price too high (in my opinion)”. At that point, his chronic loss-producing company had a market cap of $130 billion. Today, that number is $280 billion.
Accordingly, Mr. Musk’s opinion was even further off-the-mark than that of Alan Greenspan, at least in terms of speed toward more than doubling. And just as Mr. Greenspan became a late-stage cheerleader for the tech bubble, Mr. Musk is now twitter-tormenting the shorts including one last week that mixed both porno and narco allusions, along with belittling the SEC. Somehow, his latest tweet neglected to mention his May 1st blurb (in the fullness of time, I suspect that one will be validated). But, certainly, Mr. Musk appears totally oblivious to the Biblical proverb: “Pride goeth before the fall.” Almost as certainly, he will eventually learn its veracity, as have so many other chest-pounders in the past.
The correlated flip-side of buying at ever higher prices is, of course, selling during panics. This happened in 2008, the end of 2018, and, naturally, during this year’s March Madness.
To that point, Fidelity Investments reported that 1/3 of its over-65 client base sold out entirely during the March crash. At Vanguard, the numbers were apparently far better but a mere 5% rebalanced. One would think that the astute, self-directed folks using Vanguard would have aggressively shifted from bonds into stocks but, alas, that was not the case.
This situation becomes even more injurious when adverse performance continues for years, as it did for tech from 2000 through 2006 (that’s hard to believe these days, isn’t it?). The prestigious firm Research Affiliates (founders of a “smart” benchmarking and investing methodology known as Fundamental Indexing) addressed this recently in a white paper.
Their basic point in this missive is that once an asset class is declared “broken”—basically, the majority of investors treat it as uninvestable—superior future returns are highly probable. To wit: “In the five years after an asset class was declared broken, each roared back in a strong, and for many, swift rebound. All except one snapped back within one year, generating returns that ranged from 14% for US stocks to 68% for commodities. The sole dawdler, REITs, rebounded in 18 months, ultimately delivering a cumulative 86% return at the five-year mark—the weakest performance of the group.
How do the (‘broken’) asset classes perform on a relative basis? Recall that broken asset classes in our survey had mostly fallen short of the performance of the S&P 500 in the years leading up to the proclamation they were broken. In the subsequent three years, these asset classes surpassed the performance of US stocks on a cumulative basis by an average of 45%, or 13% a year.” (Emphasis added)
This is another cornerstone of our Right Cycle Investing process. It leads us to overweight the asset classes that are in disfavor, often truly hated, due to poor recent performance. Consider gold mining stocks in early 2016 after five years of negative returns (and before that, five years of stellar gains). In 2011, in the wake of their great run due to a belief the Fed’s initial money printing binges would create high inflation, they were beloved. Five years later, the gold miners were in full lunar eclipse. And, of course, since then they’ve produced eye-popping profits. Clearly, miners remain far off their 2011 highs, despite gold itself nearly back at its peak around that time. In my mind, this indicates miners can run up much further in the years to come.
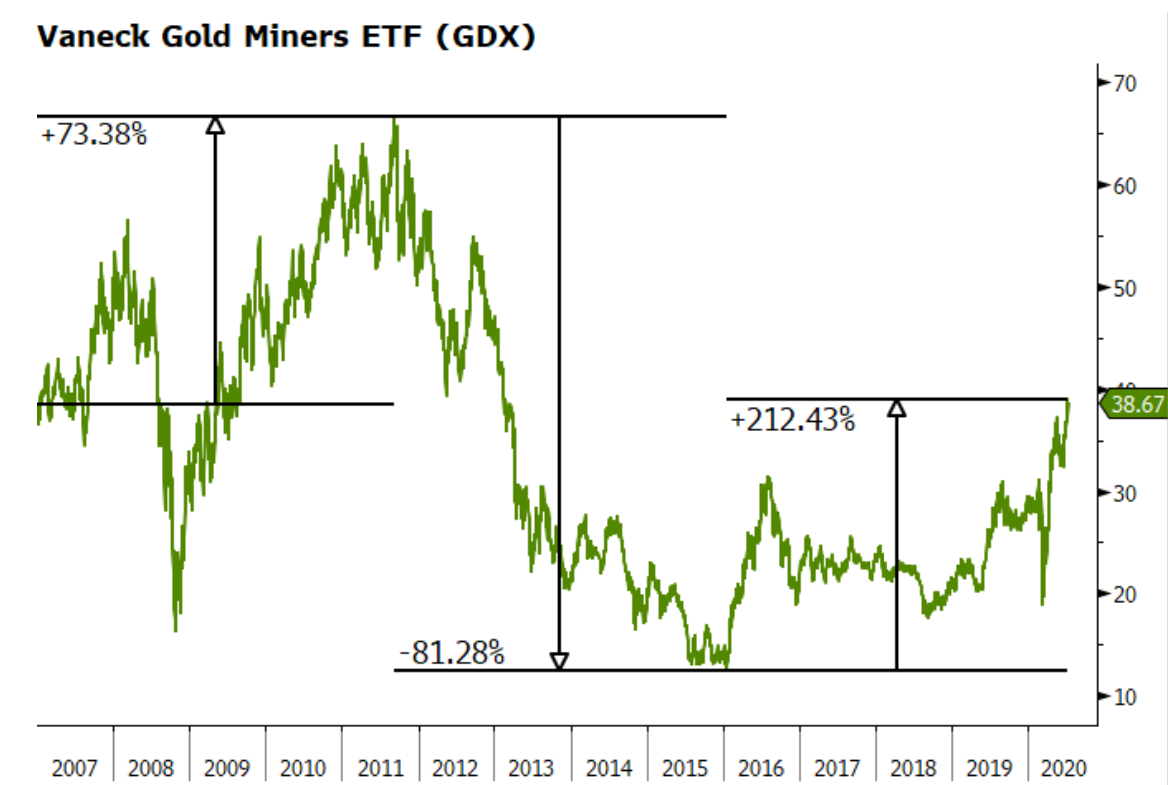
Source: Bloomberg, Evergreen Gavekal
Most “systems”—i.e., those processes designed to out-perform the market—eventually fizzle out because they can be imitated or they don’t actually work. In this case, though, that’s highly improbable, unless human nature changes. In reality, humanity’s wild emotional swings between fear and greed are seemingly becoming more acute, as this year has graphically demonstrated. If an investor can systematically position contrary to what the blundering thundering herd is doing, the kind of results Research Affiliates highlights are realistically attainable.
But, and this is another gargantuan “but”, it’s exceedingly hard to follow this approach. A “busted” part of the market (aka, asset class) can stay busted for a long time, as was the case with gold miners from 2011 to 2016 and energy from 2015 until now.
To that point, Evergreen has been test-driving with real money (mine) a refinement to our Right Cycle approach to mitigate the contrarian’s recurring problem of “premature accumulation syndrome”. The results have been highly encouraging and they are consistent with the basic Right Cycle dictum of “be fearful when others are greedy and greedy when others are fearful”, which we shamelessly copied from Warren Buffett. We will provide you more information on this in the near future.
For the here and now, the most pressing question is whether stocks are having their early 2000 or even early 1973 moment. That long-ago period had perhaps more similarities with today’s market, political and economic environment than did the tech bubble. The early ‘70s were characterized by an economy with serious problems, mostly due to inflation (not an issue now…yet). There was tremendous social strife, America’s global prestige was in a severe bear market, and the sitting president then was increasingly under siege. Yet, stocks were soaring, especially the so-called Nifty Fifty. These were the elite collection of alleged one-decision stocks that an investor supposedly only needed to decide to buy and then just sit back and get rich. These were companies like IBM, Xerox, Polaroid, Eastman Kodak, K-Mart, Merck, Digital Equipment, McDonald’s, Avon, Walt Disney, and Simplicity Patterns.
What’s striking about this partial list of yesteryear’s nifty ones is how many either went broke, were taken over on the cheap, or devolved into irrelevance. The highest P/E among this elite cohort was Polaroid at a snappy 90. Sadly, it was one of those destined to put up the shutters, as the Brits say. Even the best, for the most part, went through over a decade of very poor, often negative, returns.
Today, it’s hard to fathom companies like any of the FANGM stocks becoming irrelevant, much less insolvent. Yet, I’m sure that’s how investors felt about Polaroid, K-Mart and Kodak back then. But, in our day and age, the list of companies that are trading at outrageous valuations, including one large-cap tech name trading at 50 times sales, is a very extensive one. It’s certainly not limited to 50 issues; I suspect, it’s closer to 500 (out of the Wilshire 6000). It might even be higher considering that the mid-cap growth index trades at 39 times earnings, for those that have any profits, nearly double its 20-year average P/E. And, frankly, I’m hard-pressed to see how it’s going to be possible to make much money even on Apple and Amazon based on their over 1 ½ trillion market values. If there is any bad news, a retracement back to a “mere” $1 trillion, or under, would almost certainly be very swift and very painful.
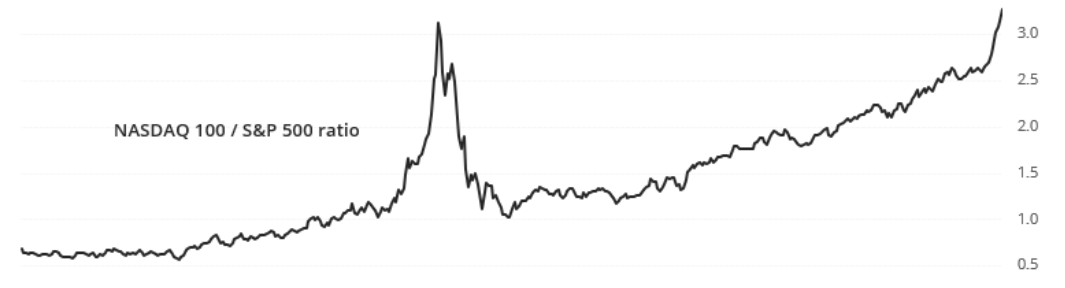
It’s also illuminating to look at the 20-year “return” even on the currently unstoppable NASDAQ, adjusted for the ultimate hard-currency in this increasingly soft-currency world, gold. The following chart reveals that both the NASDAQ and the S&P 500 have actually generated negative returns when adjusted for the price rise in gold over the last two decades. Thus, although both indexes have made roughly 6% annually in US dollars, it’s arguable that the nominal per year returns on those two key indexes have been a classic money illusion; i.e., they have, in reality, been losers using a hard-money benchmark. Based on “the gold standard”, the NAZ and the S&P have lost 4% and 5% per year, respectively, since the start of this century/millennium.
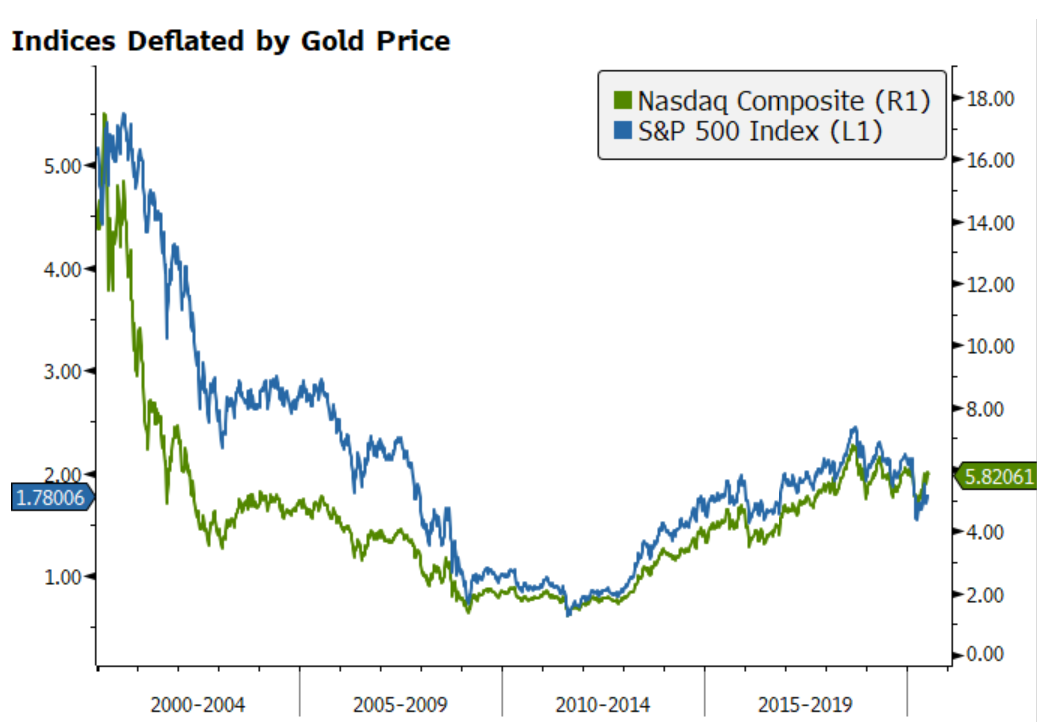
Source: Bloomberg, Evergreen Gavekal
Despite how poorly even the NASDAQ has done in the ultimate hard currency, the current love affair with tech is torrid. Valuation considerations are not considered at all. This is typical late in a bubble when buyers herd into the hot area with total value insensitivity. No price is considered too high. The stampede into the sexiest stories, particularly, right now, those that benefit from COVID, seems like it will never end. But, then again, that’s how it always works during full-blown bubbles.
In this nightmarish COVID era, we’re all hoping we eventually get to herd immunity. In the financial markets, though, we’ve already achieved herd impunity. Yes, I realize “immunity” and “impunity” are closely related. Yet, the latter implies a recklessness similar to the behavior of the millions of young people who act like COVID can’t get them. Similarly, investors appear to believe they aren’t taking serious risks by herding into the most popular and hyper-inflated stocks. If market history is any guide, they are likely to learn the same lesson that is now dawning on the throngs of youthful and mask-free bar-hoppers.

David Hay
Chief Investment Officer
To contact Dave, email:
dhay@evergreengavekal.com
DISCLOSURE: This material has been prepared or is distributed solely for informational purposes only and is not a solicitation or an offer to buy any security or instrument or to participate in any trading strategy. Any opinions, recommendations, and assumptions included in this presentation are based upon current market conditions, reflect our judgment as of the date of this presentation, and are subject to change. Past performance is no guarantee of future results. All investments involve risk including the loss of principal. All material presented is compiled from sources believed to be reliable, but accuracy cannot be guaranteed and Evergreen makes no representation as to its accuracy or completeness. Securities highlighted or discussed in this communication are mentioned for illustrative purposes only and are not a recommendation for these securities. Evergreen actively manages client portfolios and securities discussed in this communication may or may not be held in such portfolios at any given time.