
“Most of the money you’ll win at poker comes not from the brilliance of your own play, but from the ineptitude of your opponents.”
-Lou Krieger
“In the business world, the rearview mirror is always clearer than the windshield.”
-Warren Buffett
Know when to hold ‘em, know when to fold ‘em. A few weeks ago, my wife and I celebrated our first child’s birthday—a rite of passage for many young families. Grateful to have made it through the first year, we marked the occassion with family, cake, presents, and an exhausted one-year-old daughter.
Before her birth, every parent we knew or met warned us how much our lives would change when we had our daughter. As is the case with most unsolicited advice, I failed to fully appreciate the ramifications of those warnings. But I sure do now!
These days, getting to spend an evening with some of my closest friends and playing poker—a routine once taken for granted—has become cherished time. I get to relax, talk sports (mostly Super Bowl-related), share a few laughs, and enjoy the camaraderie. I don’t want to mislead anyone: I also like to win money. And while we don’t play high stakes poker, sometimes I forget it’s just $40 of chips sitting in front of me. Instead, I find myself wandering and transporting to the Harrah’s poker room competing in the World Series of Poker.
As you can no doubt tell, I enjoy these games, which, along with my strong desire to win money, leads me to take them quite seriously. We typically play no-limit Texas Hold‘em tournaments that can last quite awhile (for non-poker players, you’re dealt two cards face down before the shared cards are dealt up to the table). Unfortunately, bluffing, or deceiving the table into thinking I have a better hand, has never been my strong suit (not that I would admit it if I thought it was!). Therefore, I tend to only play very strong hands, because the odds are in my favor. For example, I typically won’t play if I am dealt a Jack and an 8. This combination gives me about a 51% chance that my cards will end up being the best hand. It’s tempting to play through, because of the face card, but I know I will be dealt much better hands if I’m patient. Thus, I often find myself sitting out of the action and watching my friends play for the big prize.
Sometimes, it can be quite difficult to fold a Jack and an 8, only to find out that the winning hand was a Jack and a 4 (a worse hand). In these moments, I’m forced to remind myself to stick with my game plan. Eventually, I know the odds are very high that my friend Alex (the most likely to play terrible hands), will be sitting to the side of the table, as busted as Venezuela, watching us all play.
I started off this EVA discussing my Texas Hold ‘em strategy not because I am in desperate need of coaching, but to point out the many similarities between the markets and the game of poker. When we invest, we know that we should be patient. We also know we don’t have to invest in every opportunity presented and that we’re not going to be right on every investment. And we’re keenly aware that most of the game is just weighing the odds that are available to us. As in poker, many know what should be done under certain investment conditions, like during manias, be they in stocks, houses, silver, or emerging markets. Yet, millions choose to go against the odds and hope “Lady Luck” smiles on them. Often this takes place because seeing other people make money, while you wait for a better hand is contrary to the way we’re wired. Let’s face it—we want our profits and we want them now.
This mind-set is clearly front and center these days, begging the question: How much have we learned from the experience of the last fifteen years?
When will they ever learn? When asked what the market would learn after the Great Recession, Jeremy Grantham, legendary investor and head of Boston-based GMO capital (with $117 billion in assets under management), said: “In the short-term a lot, in the medium-term a little, in the long-term, nothing at all. That would be historical precedent.” Recent market action indicates just how prescient his words were when he uttered them several years ago.
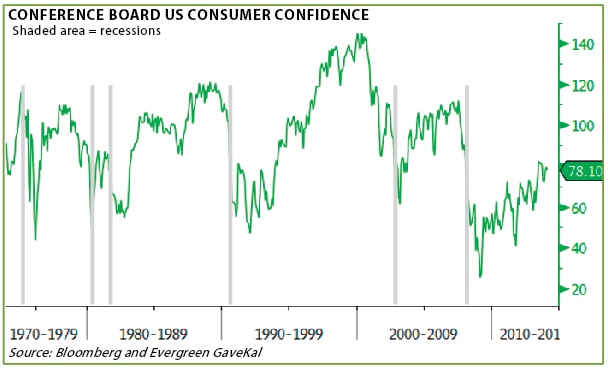
The optimism that permeates in a bull market leads us to disregard warning signals from previous periods of what Alan Greenspan used to call “irrational exuberance” (at least until he succumbed to that same fate himself). Similarly, the pervasive panic in the middle of recessions can deter investors from jumping on historically low valuations and, thus, missing great return potential. Below is a chart of the consumer confidence index since 1969. As you can clearly see, optimism is at its highest point in a cycle right before a recession starts. (Encouragingly, there is no sign of over-optimism on the US economy right now, a key reason Evergreen doesn’t anticipate a recession in the foreseeable future.)
One of the great benefits to working with GaveKal is that we get to be part of their internal research exchanges. It’s a blessing to not only have access to the published research, but also to witness the internal debate behind what goes into the finished product. Charles Gave often likes to state how he is a simple man and, thus, likes to keep things easy to understand. This is my goal as well. I want to present some simple charts that show why we believe the US stock market, unlike the economy, is vulnerable to a “reality-bites” scenario.
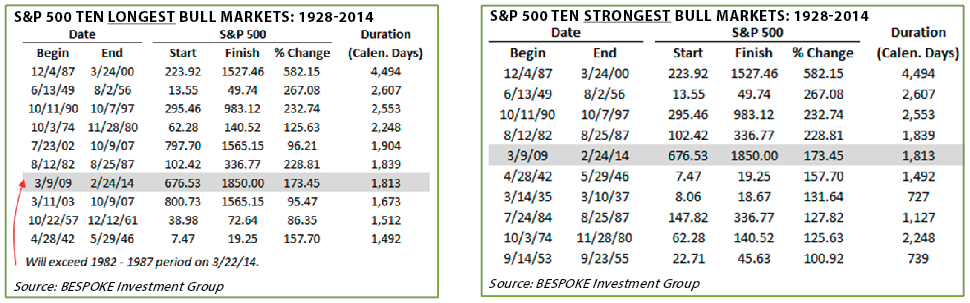
Since 1928, the average bull market has lasted 2.6 years. We are considered to be in a bull market any time the S&P 500 rises more than 20%, and a bear market is the inverse. Since 1928, we’ve had 23 bull markets. Currently, we’ve been in this bull market for 1,824 days, or, essentially, five years. It is quickly approaching the 6th longest bull market since 1928. It’s also the 5th largest total return of any bull market.
Warren’s warning. Unlike poker, in the markets there are no set odds. Many assumptions must be made, and determining fair value can be a murky proposition. However, the markets do have a significant amount of historical data that can be used to help discern if stocks in general are over- or undervalued at any given point in time.
In order to gauge a market’s fair value, it makes sense to me to look at the same metrics used by some of the world’s great financial minds. Warren Buffett, a definite face on the Mt. Rushmore of Finance, is famous for saying, “Investing is simple, but its not easy.” One of the simple metrics that he likes to look at is market-cap-to-GDP. In a 2001 Fortune article he said of this ratio: “it is probably the best single measure of where valuations stand at any given moment.”
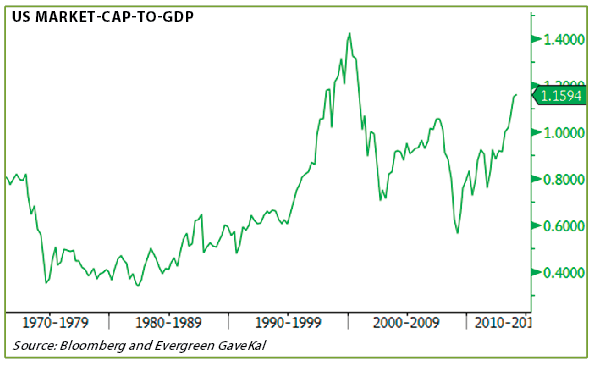
According to this reading, we’re currently in the middle of the second most expensive market in the last 44 years. (In fact, per John Hussman, this applies to at least the entire post-war era; only the late 1990s were pricier and that would prove to be a disastrous time to be investing in stocks.) Presumably, the Oracle of Omaha is getting a bit antsy these days.
Next, lets look at a measure from the academic side of the financial world. Professor Robert Schiller of Yale University is well known for calling the tech bubble in the late 1990s and for his repeated warnings on the elevated US housing prices in the early to mid-2000s. On top of that, last year Professor Schiller was awarded the Nobel Prize in economics. As readers of EVA know, Professor Schiller developed a P/E ratio that takes the current price of the market and divides it by the average earnings per share over the previous 10 years. This is done as a way to smooth out major earning declines and advances.
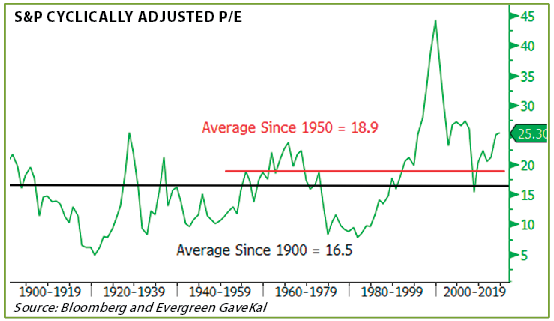
Again, this metric is not at its all-time high, but other than the most expensive market ever, it’s right there with any other peak we’ve experienced. So, if investors are betting this market will get to the insane levels of 2000 again, then it appears Jeremy Grantham was right about what would be learned from the Great Recession—as in, not much.
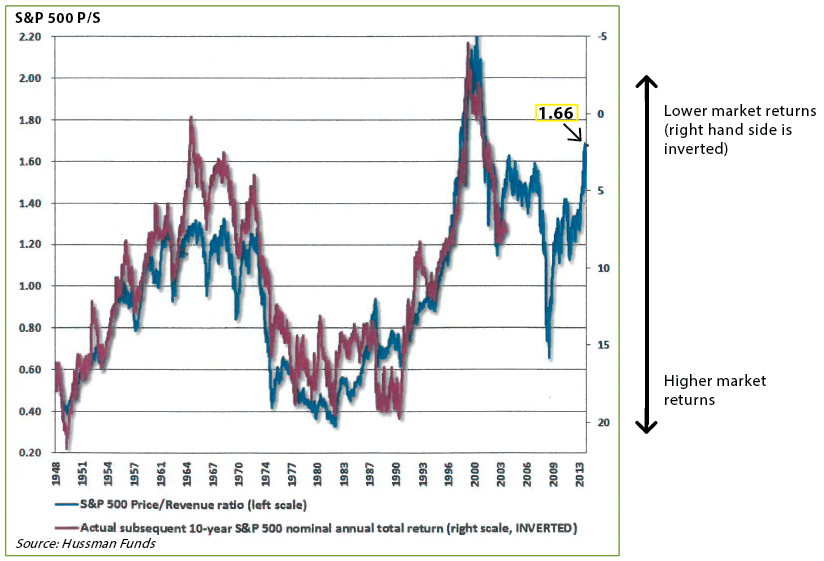
The next measure that I use religiously has been repeatedly beat into my head over the last eight years by our Chief Investment Officer, David Hay. He believes that the price-to-sales (P/S) ratio is a critical indicator because, as he says: “Sales can’t be manipulated in the way earnings can." Revenue is a gross number that is far less affected by the economic cycle. In 2012, S&P 500 revenues grew 4.5% from 2011. Then, in 2011, this lackluster sales growth was followed up with an even less impressive 3.5% increase. When you stop and consider that the market has gained 55% since the end of 2011, with only 8% revenue growth, it should at the very least raise an eyebrow—maybe an entire forehead.
An investor should be willing to pay a higher P/S ratio if they expect revenues to grow rapidly, or a larger portion of sales to flow down to earnings (i.e., rising profit margins). Currently, US stock investors are paying a higher P/S multiple than in 2007. In order for this to be an opportune time to be an avid buyer of stocks, at least on a long-term basis, the 500 companies that comprise the S&P must rapidly grow revenue and/or improve margins from here. As we'll discuss in a bit, that looks to be a big challenge. (Note also, based on the red line below, that P/S ratios have consistently led to poor future returns.)
Lies, damn lies, and P/Es. Amongst talking heads on CNBC, the most commonly discussed valuation metrics are simple price-to-earnings (P/E) ratios. The two routinely mentioned P/E ratios are the forward P/E and the trailing P/E. They tell you at any given moment the multiple that you will have to pay for a percentage of the company's (or the market's) future or past earnings. In today's market, these two metrics are routinely mentioned as bullish signs for investors who think the market has room to go much higher.
Taking the market capitalization and dividing by the last twelve months of actual earnings calculates the training P/E. Based on this calculation, the market is currently trading at around 17.2x 2013 earnings, which is modestly above its historical average of 16x. The forward P/E looks at the current price of a stock and divides it by next year's analysts expected earnings. Currently, the market trades at 15.9x earnings while the long-term average is 15x. Again, bulls use this number to argue that the market is reasonably valued. However, in order for both of these valuations to be proven cheap, we must have earnings growth from here.
This won't shock anyone, but analysts' estimates are often far off the mark. For example, in 2007 analysts expected earnings to grow about 10% for 2008. This was a "slight miss" as earnings came in about 53% lower than consensus estimates. In fact, actual earnings for 2014 of $108 per share are still below the highest consensus estimate for 2008. Moral of the story: It's wise to evaluate future earnings expectations based on reliable metrics, like earnings relative to the size of the economy, and considering other factors beyond just what analysts are saying.
Earnings growth is important, because if we don’t get the growth, we’ll end up paying an even higher multiple than we originally thought. A major problem we see when reviewing the consensus earnings projections for the next few years is that these indicate a steady up-trend. Unfortunately, history indicates this is highly unlikely; we have a bear market every four years. Unsurprisingly, these are often caused by plunging earnings, which the majority of economists, strategists, and investors never see coming.
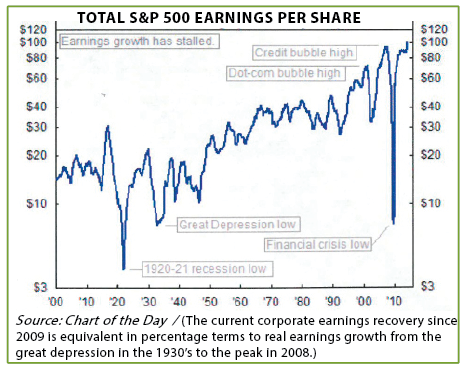
Analyst earning estimates for next year expect 9% growth from 2013. In fact, analysts expect profits to grow about 11% in both 2015 and 2016. In order for that to be the case, revenue expansion needs to increase and margins must continue to stay lofty. The days of companies reporting earnings increases that are much higher than sales growth are likely coming to an end.
Of course, anything is possible. Perhaps even without the previous tailwinds of falling interest costs, labor expenses, and taxes, the incredible profits run of the last five years can continue. However, we think this is akin to betting heavily on a Jack-4 Hold’em hand, probably worse. The odds are particularly adverse with S&P operating margins already sitting at their highest levels since at least the 1960s, a time when corporate America had pretty much no overseas competition. In a similar vein, as highlighted in several past EVAs, earnings are now a bigger percentage of GDP than any other time in history. This ratio over the last 44 years has swung between 7% of GDP in recessions to today’s high of almost 12.5%.
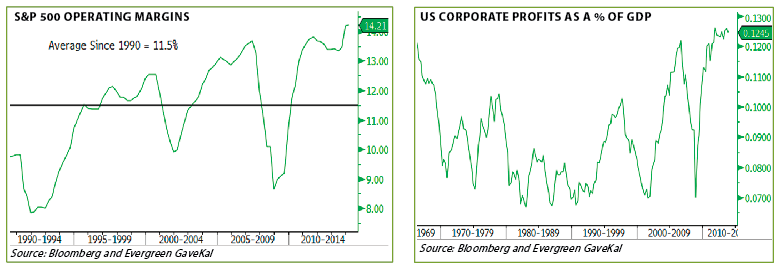
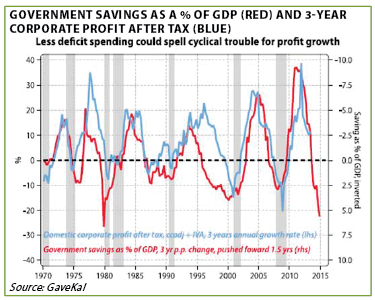
For the geekier among you, the relationship between corporate profits and the combination of government deficits and household savings draw-downs is known as an accounting identity (i.e., there is a precise link). Thus, when the government is spewing red ink and consumers are spending beyond their means, earnings boom—and vice versa—as the following chart clearly indicates. It is no coincidence that since the Federal deficit has begun to shrink, corporate profit margins have been rolling over.
The Patient Shall Inherit the Returns. On the surface, I'd understand if someone looked just at P/E ratios and believed the market was reasonably valued. This is a simplistic approach that even the Fed, with all of their super sophisticated models, inexplicably uses (fortunately, Dick Fisher, incoming member of the Federal Open Market Committee, has pointed out the fallacy of the Fed's standard valuation technique).
Realistically, even a mild earnings normalization could make this market very expensive. Consequently, we believe the desk is currently heavily stacked against a long-term investor, even if momentum carries higher from here.
I am fully aware of the critiques that are out there for many of the valuation measures mentioned above. In an effort to save my inbox from data overload, I'm familiar with Siegel's arguments against the Schiller P/E, and I agree that margins are trending higher. We've argued against these bullish theories in past newsletters, and only time will prove who's actually correct. To me, it appears at best, you can argue that this market is just modestly overvalued.
In the current environment, we are convinced that being selective and patient is the right approach to take, realizing that it is very hard to do right now with the market continuing to make new highs. Ultimately, we are highly confident there will be a time when the probabilities for good returns are significantly more in our favor.
Charlie Munger, Warren Buffet's partner at Berkshire Hathaway, said, "it takes character to sit there with all that cash and do nothing. I didn't get to where I am by going after mediocre opportunities." In today's market, we do see some good to decent long-term opportunities in US income securities, high-quality US equities, and some emerging markets. Overall, though, we stand in lockstep with Munger's statement. When mediocre—or even inferior—opportunities abound, as is clearly the case right now, we'll take our chances folding until the right hand comes along to cash in on the overconfidence of others.
IMPORTANT DISCLOSURES
This report is for informational purposes only and does not constitute a solicitation or an offer to buy or sell any securities mentioned herein. This material has been prepared or is distributed solely for informational purposes only and is not a solicitation or an offer to buy any security or instrument or to participate in any trading strategy. All of the recommendations and assumptions included in this presentation are based upon current market conditions as of the date of this presentation and are subject to change. Past performance is no guarantee of future results. All investments involve risk including the loss of principal. All material presented is compiled from sources believed to be reliable, but accuracy cannot be guaranteed. Information contained in this report has been obtained from sources believed to be reliable, Evergreen Capital Management LLC makes no representation as to its accuracy or completeness, except with respect to the Disclosure Section of the report. Any opinions expressed herein reflect our judgment as of the date of the materials and are subject to change without notice. The securities discussed in this report may not be suitable for all investors and are not intended as recommendations of particular securities, financial instruments or strategies to particular clients. Investors must make their own investment decisions based on their financial situations and investment objectives.