
The Most Dangerous Chart on Wall Street?
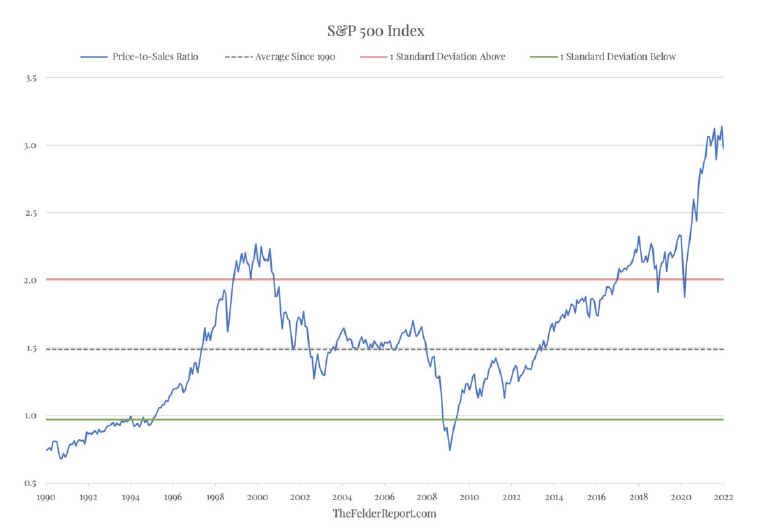
Yes, I admit it. The following image doesn’t look very scary--especially not compared with many of the market valuation charts such as the one immediately below it showing the towering price-to-sales ratio for the S&P--but please allow me to explain my reasoning.
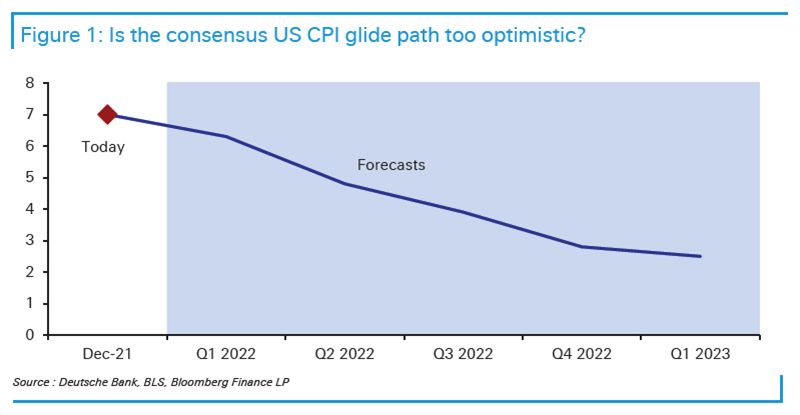
The first visual illustrates how remarkably naively complacent the Wall Street consensus is on the likely future path of inflation. A die-hard, no-worries, markets-only-go-up, type of person might blow this off as a mere survey. However, the reality is that a very important marketplace, one which prices in future inflation expectations on a second-by-second basis, agrees with this benevolent view…or at least it was.
The $30 trillion government bond market has been every bit as relaxed as the survey participants displayed above despite the CPI running in the 6% to 7% range. Yields bouncing between 1.25% to 1.75% on the key 10-year T-note are clearly assuming that inflation is truly transitory, even though the Fed has, belatedly, retired that word from its lexicon. They also imply a most unconcerned attitude toward the very belated—like insanely delayed—cessation of the Fed’s latest multi-trillion-dollar money fabrication scheme.
In fact, this fourth sequel to its original Quantitative Easing (QE) experiment, which was supposed to be “transitory” when QE I first launched in 2008, is almost certain to go into reverse gear soon. This reversal, or balance sheet shrinkage, is popularly known as Quantitative Tightening (QT). What this means in plain English is that instead of buying trillions of treasuries and government-backed mortgages, all financed by the Fed’s magical computer-generated money, it will now be a seller.
As a result, the treasury bond market will soon be experiencing the double-whammy of losing by far its biggest buyer which will now become a major de facto seller. Given the Fed’s ultra-cautious nature, it is more likely to let its bonds simply mature versus actually selling them. Yet the impact is similar. This is particularly the case when the federal government has a continuing need to raise over $100 billion a month, due to its voracious burn-rate--despite that its revenue in-take is at record levels. A non-reinvesting Fed (i.e., not recycling the proceeds from its maturing bonds back into new ones) may well create some serious upward pressure on longer-term interest rates.
The implications of this massive shift may suddenly be dawning on the bond market. As of today, the 10-year yield is pushing toward the critical 2% level. This is contrary to what the many vocal bond bulls have been predicting. Personally, I believe it will soon be penetrated to the upside, just like I don’t think the $100 ceiling will hold in the oil market (and there is a connection; exploding energy costs put upward pressure on inflation and, in turn, on bond yields).
This is why the extremely cavalier attitude of Wall Street toward inflation later this year could lead to such a seismic shock. If instead of smoothly gliding down to near 2%, it remains, as I believe, sticky around 4% to 5%, or even higher, the market reaction could be volcanic. When you combine that with the price-to-sales chart shown above, it could spell, like that old Elvis Presley hit, T-R-O-U-B-L-E.
If so, the Pavlovian investment reaction to any market weakness that has worked so well for 13 years—Buy The Dip!—might also need to do a flip—as in, Sell The Rip!—similar to the looming inversion of the Fed’s QE. For instance, the Nasdaq’s spirited 7.3% rally since last week’s trough, when it had tumbled 18% from its late November high, could be a chance to reduce exposure to still very expensively valued growth stocks that appear to be, in many cases, breaking down in a material way. Despite the recent bounce, bad news, such as with Meta yesterday, seems to be producing much more downside than good news is creating upside, like Amazon today.
Once again, this environment reminds me more and more of 2000 when the 1990s tech bubble had popped but there were a number of powerful snapbacks on the way to the Nasdaq’s eventual 78% peak-to-trough meltdown. My best advice in this regard: don’t get sucked in by these alluring rallies and remain focused on the long-term trend. In my mind, that is a relentless shift of trillions of dollars into value stocks, particularly those in overseas markets. However, some former growth names have been so badly pummeled that they now are looking very GARP-like—as in, Growth At a Reasonable Price. These are much more in my comfort zone than the COPS—the Crazy Over-Priced Stocks—that are suddenly not nearly as over-priced as they once were.
Positioning Recommendations
As I discussed at the end of the introduction to our EVA PR, there has been such large number of former growth stocks that have had 2 for 1 splits, even 3 for 1, but without the additional shares, that growth-at-a-reasonable price (GARP) situations have proliferated. Thus, it’s time to do some gradual buying of these names—emphasis on gradual. A certain mega cap-tech name that is trying to capitalize on what it believes to be a meta-opportunity is one example. Another is the leading digital payment company which is now down 60% from its 2021 zenith; thus, it has been no pal to its shareholders lately. However, there has been enormous technical damage done to issues like these. Accordingly, the eventual recoveries are likely to be drawn out affairs.
LIKE
Many of the MLP-like Renewable Yield Companies have come down hard of late. They may not be strong buys at this point, but they are probably worth some nibbling.
NEUTRAL
DISLIKE
Taking a shallow bow here: our persistent warnings on longer-term treasuries and corporate bonds has proven to be justified. At some point, there should be a counter-trend rally but the long-range outlook for extended maturity fixed-income debt is not encouraging.
DISCLOSURE: This material has been distributed solely for informational purposes only and is not a solicitation or an offer to buy any security or to participate in any trading strategy. Any opinions, recommendations, and assumptions included in this presentation are based upon current market conditions, are subject to change, and reflect the personal opinions of David Hay (an employee of Evergreen Gavekal) as of the date of this publication. This publication does not necessarily reflect the views of Evergreen’s Investment Committee as a whole. All investment decisions for Evergreen clients are made by the Evergreen Investment Committee. All material presented is compiled from sources believed to be reliable, but accuracy cannot be guaranteed, and Evergreen makes no representation as to its accuracy or completeness. Securities highlighted or discussed in this letter have been selected to illustrate the author’s investment approach and/or market outlook and are not intended to represent Evergreen’s performance or be an indicator for how Evergreen or its clients have performed or may perform in the future. Each security discussed in this letter has been selected solely for this purpose and has not been selected on the basis of performance or any performance-related criteria. The securities discussed herein do not represent an entire portfolio and, in the aggregate, may only represent a small percentage of a Evergreen’s client holdings. Evergreen actively manages client portfolios and securities discussed in this communication may or may not be held in such portfolios at any given time. Before making an investment decision, the reader should do their own research and/or consult with their financial advisor. Past performance is no guarantee of future results. All investments involve risk, including the loss of principal.