
“However beautiful the strategy, you should occasionally look at the results.”
–WINSTON CHURCHILL
“Beyond inflating and bursting a bubble in corporate debt (with leveraged loans acting as posterchild), the Fed’s decade-long financial repression has had a far larger and more sinister impact. It has silently bankrupted the US pension system.”
–Macro Mavens' STEPHANIE POMBOY
“There are certain things that cannot be adequately explained to a virgin either by words or pictures. Nor can any description that I might offer here even approximate what it feels like to lose a real chunk of money that you used to own.”
–FRED SCHWED, JR., in his book Where Are the Customers’ Yachts?
At the beginning of 2018, we initiated a new EVA series titled “Bubble 3.0” with excerpts from David Hay’s upcoming book titled “Bubble 3.0: How Central Banks Created the Next Financial Crisis”.
If you are just joining us in the middle of this ongoing series, which will eventually culminate in a full-length publication, please read the prior installments in the series here:
BUBBLE 3.0: THE POST-RETIREMENT SOCIETY
Many social commentators, probably rightly, assert that Western culture is in the post-phase: Post-modern, post-religion, post-civility, post-bipartisan, post-patriotic, post-prudence, post-hope, post-tolerance and, perhaps, most inarguably, post-truth. But the “post” that is the topic of this month’s installment of “Bubble 3.0” is based on the thesis that the relatively recent phenomenon of a comfortable retirement is now also increasingly a thing of the past.
One does not have to be a history major to know that it’s only been in the last four or five generations that most individuals were able to plan for financial security during their so-called golden years. In fact, it’s largely been since WWII that the idea of 20 or 30 years (or maybe 40 or 50, if you worked for the Federal government or the State of California) of financially secure leisure after retiring was anything other than a pipe dream for the average person. Unfortunately, we may well be in the process of going full circle in this regard.
One critical aspect that has increasingly gone “post” over the last few decades is the once sacrosanct defined benefit pension plan. (Government workers have largely been shielded from this shift but that may be changing.) In its place, the now nearly ubiquitous 401(k) has emerged as the main retirement asset-builder, especially for private sector workers.
At this point, a brief tutorial is in order. A “defined benefit” plan is exactly what it sounds: a specific dollar amount per month is provided, typically based on years of service and income earned (up to a maximum threshold). The most familiar and popular version of this is, of course, social security. But in the pre-post-retirement era, it was common for millions of rich country workers to have some kind of guaranteed pension plan, at least if they worked for a medium-to-large-sized company or, of course, for their government. Unfortunately, particularly in the US, one of the casualties of the relentless effort by America’s corporate managers to drive down costs has been the once commonplace defined benefit pension.
The lengthening of American lifetimes, at least until recently, also played a role. Obviously, providing a monthly stipend became increasingly costly as life-expectancies improved. Combined with the soaring costs of retiree healthcare benefits, US companies tried to do whatever they could to lower their future liabilities. Since it was most challenging to try to get out from under the retiree healthcare burden, at least for current employees, the lower hanging fruit became the defined benefit plan. Thanks to a surging stock market in the 1980s and 1990s, the timing was ideal for a switch to a defined contribution model, typically the now nearly omnipresent 401(k).
The reason this worked so well in an epic bull market is because the high returns it produced accrued to the account beneficiary rather than the plan itself. You may recall it was quite common, especially in the 1990s, for those pension plans that were still in place to have become highly “overfunded”. This allowed companies to defer contributions, often for years, flattering profits. (Companies frequently adopted a two-tier approach where older workers were covered by defined benefit plans while newer and/or younger workers were sent into 401(k) plans. Often, veteran employees were able to keep their previously accrued defined benefit credits while shifting new contributions into 401(k)s.)
But once the tech bubble burst in 2000, it was an entirely new ballgame. Due to the fact that the S&P 500 had become heavily exposed to tech and telecom stocks by the end of 1999, with almost 50% of market value in just those two sectors, the 82% and 73% declines they experienced, respectively, caused the market to be basically cut in half. It was at that time we first heard the sardonic, but not entirely distorted, joke: “My 401(k) is now a 201k.”
In the past, the ravages of a ferocious bear market would have hit a retirement plan participant’s company and not his or her own account balance. But, as my wife likes to say, “you can’t have it both ways”. Unfortunately, in 2008, after a few good years from 2003 to 2007, it was time for another 50% wipe-out. The 201(k) was back.
But on the fortunate side, at least for those who didn’t panic during either of those two crashes (the worst, by the way, since the 1930s), stocks have experienced one of the best 10 years in history. In fact, the rally has been so powerful that the S&P 500 has now returned a not-so-grand or glorious 5.7% per year since 12/31/99. That was less than what treasury bonds were yielding back at the start of this millennium but at least it is now a positive number. As recently as 10/03/2011, it was still negative.
EVA readers with a facility for numbers might recognize there’s a glitch with that 5.7%, particularly for the remaining defined benefit pension plans, which includes virtually all state and local retirement programs. Because return assumptions have long been in the to 8% to 9% range, a nearly 20-year output of less than 6% from what should be the highest returning portion of plan assets (at least for the publicly-traded portion) is more than a bit problematic. It’s also a safe assumption that most 401(k) plans have struggled to keep pace with this modest return since participants have a nasty tendency to shift into stocks when they’re high and get out after big declines. Furthermore, being diversified in overseas equities has not been a boon due to the fact that the main international benchmark, the ex-US MSCI World Index, has generated a total increase of only 3.8% annually from the end of the 1990s to now. In fact, this index is still 18% below where it traded in 2007.
But back on the sunny side, bonds have helped offset this poor equity showing. Falling interest rates have produced unusually high returns. If one was savvy enough at the end of 1999 to buy a 30-year zero coupon Treasury bond in their 401(k)—assuming they had that choice (many plans do not have that option)—the annual gain would have been 9.25%. Other bond-type investments have generated very healthy returns, though not as lofty as a long-term zero coupon treasury since those benefit the most from falling—make that collapsing—interest rates. For example, the Merrill Lynch long-term corporate bond index has returned 7.6% per year since the start of the 2000s.
Of course, stocks, at least in the US, have been big beneficiaries of the interest rate implosion. This has allowed the S&P 500 to trade within spitting distance of its highest P/E ratio ever and at its loftiest median price-to-sales ratio of all-time. We’ve shown charts of both of these metrics numerous times in past “Bubble 3.0” EVAs so we won’t run any repeats. But it’s a bit scary to contemplate what that sub-par 5.7% return over almost 20 years would have been without such a hurricane-force tail-wind from crashing bond yields.
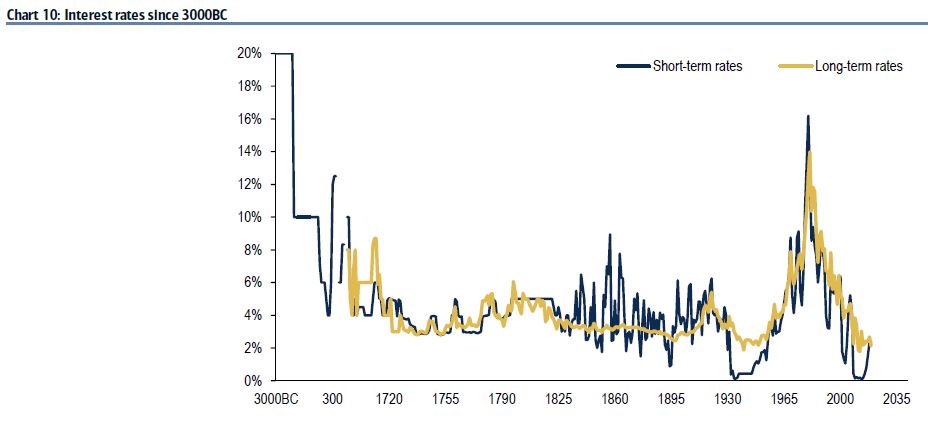
If you think I’m being a bit over the top on this point, please consider the following chart on the long-term—make that VERY long-term—history of interest rates.
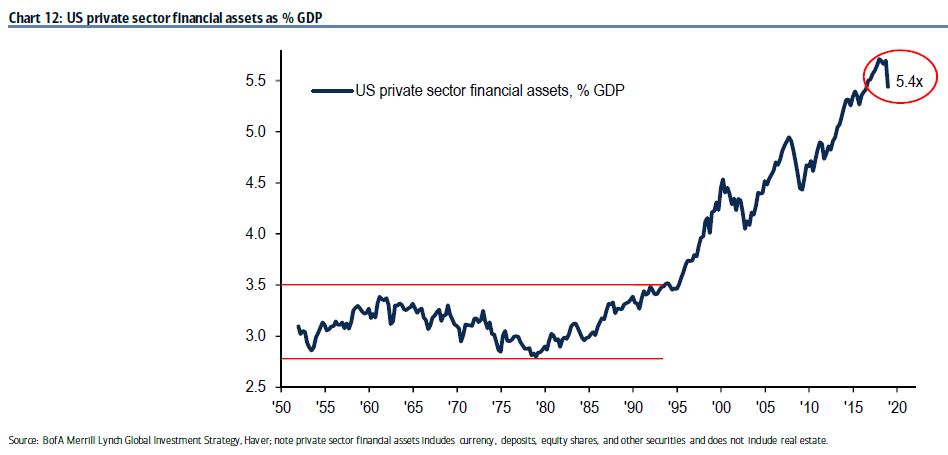
Underscoring the magnitude of the uplift from rising stock and bond prices, particularly in America, please review another chart from a thoroughly illuminating June 23rd report by BofA Merrill Lynch. It was pithily titled: “Dr. Strange Dove or How You Learned to Stop Worrying and Love the Bond”. If nothing else, this graphic points out one of the key rationales for my quixotic endeavor to write “Bubble 3.0” and for asserting we are living through the third iteration of hyper-valuation over the last 20 years.
Additionally on the scare-inducing front, is what the overall pension plan funding status would look like if stock valuations weren’t so generous and bond returns hadn’t been unusually luscious. According to Moody’s, along with S&P, one of the two main bond rating services, state and local retirement plans are underfunded to the unpleasant tune of $4.4 trillion. The Fed believes the shortfall is over $6 trillion. To put this in perspective, total state and local government revenues are $3.1 trillion.
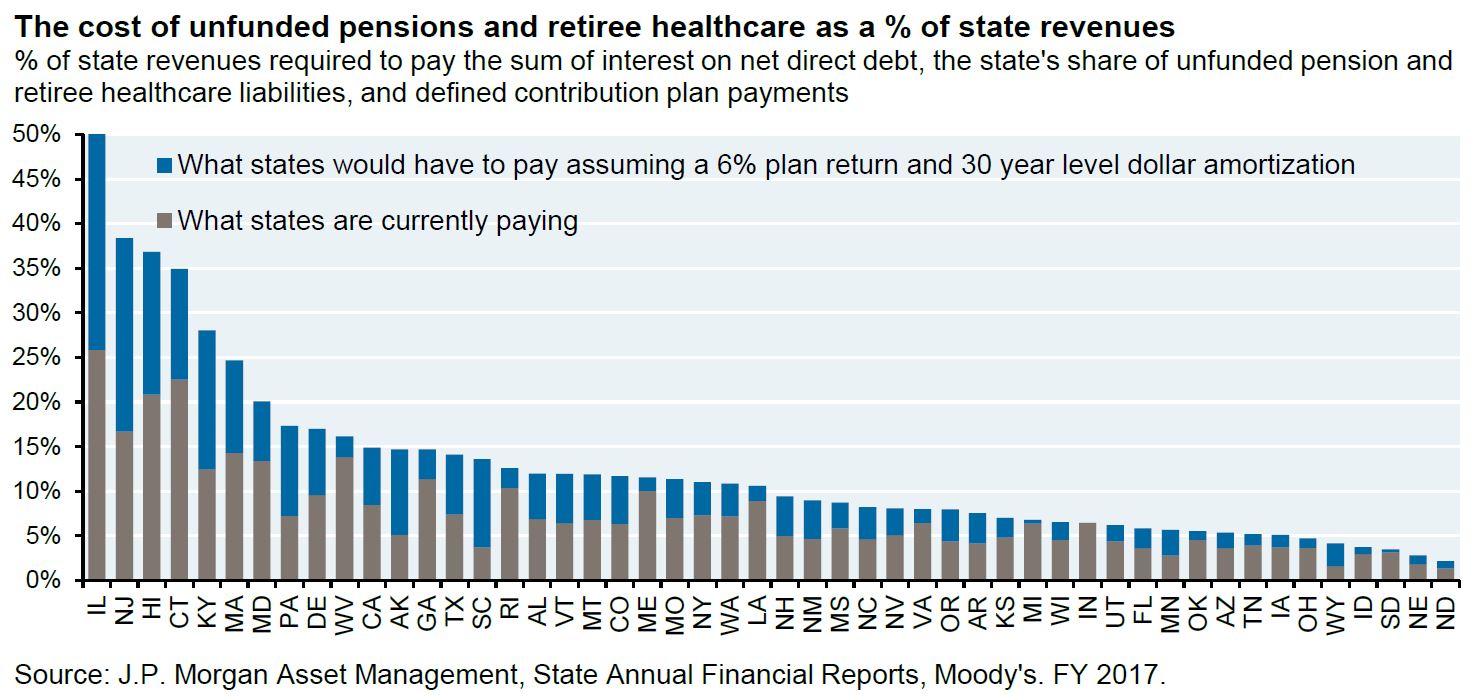
Financial newsletter guru John Mauldin quotes the American Exchange Council that these plans have only about one-third of the assets they need to fund future benefits. Specific states like Illinois and New Jersey are in such deep holes that a recent JP Morgan (JPM) research piece called their dire conditions “practically irreversible”. To back this up, JPM’s Michael Cembalest ran this graphic showing the percent of state revenues that would need to be dedicated to paying retiree pension and healthcare benefits using lowered but unlikely-to-be-attained assumptions. Please notice the difference between the blue and brown bars, with the former based on a much more plausible 6% assumed return (more to follow on that point).
The great state of California and the US Federal government are also interesting case studies on the dangers of rocketing and unfunded entitlements. Thanks to increased taxes on California’s wealthiest, and the capital gains windfall from inflated stock and real estate prices, the Golden State is running a hefty surplus. Yet, there is a powerful storm lurking off its beautiful coastline. (Or maybe I should say a devastating earthquake is looming; as I write these words on July 4th, at lovely Lake Arrowhead, about 60 miles from LA, our hotel room was just jolted by a 6.4 quake.)
Firstly, its massive public employees’ retirement entity, CALPERS, is only 71% funded desipte using an even more improbable to be realized 7% return (more to follow on this topic, as well). This is also despite the fact that all of the revenue from the “millionaire’s tax” California enacted in 2012, that raised the top rate from 10.3% to 13.3%, has been used to cover retirement benefits.
Secondly, and likely most significantly, Medical is becoming a tax revenue sinkhole—both for state and national taxpayers. Medical, California’s version of Medicaid, the health program for the poor, now covers 14 million people and “boasts” an annual budget of $100 billion, three times Illinois’ overall budget. Enrollment is surging, despite a healthy state economy. As Medical has grown, so have emergency room (ER) visits. These vaulted by 75% from 2011 to 2016 which cost, on average, five times as much as a regular doctor visit. Often, trips to the ER are for routine illnesses. ERs are so clogged that Californians are told that if they truly need urgent care they should call 911 and be taken in an ambulance since this puts them at the head of the ER queue. Obviously, the waste from all of the above is immense. Even if you don’t live in California, you should care since the Federal government roughly matches what the state spends on Medical (other states with lower income get even bigger Federal subsidies).
There seems to be a belief that Federal deficits and spending gone wild is of no import. This is particularly the case with socialists and quasi-socialists proposing enormous new entitlement programs on top of what are already unprecedented budget shortfalls in an economic expansion under Donald Trump. But one of the few guarantees I can make is that this devil-may-care mindset won’t last. Unfunded Federal entitlements are estimated to total $100 trillion—even before potential programs like Medicare For All are enacted.
In many ways, the Federal government is the worst offender in this regard. Even basket-case states like New Jersey have some portion of their retirement obligations funded by actual assets. But not the US government. As I’ve written multiple times before, the vaunted social security “trust fund” is most untrusty. There is nothing in it but Federal IOUs. Imagine if New Jersey tried to fund its entitlements entirely with its own debt obligations.
It continues to be my contention that not investing the multi-trillion dollar surpluses social security has accumulated since the 1980s into a diversified portfolio of corporate stocks and bonds was one of the greatest policy errors of the last three decades. And, it’s no exaggeration to say, there is a long list of those to choose from.
Gene Epstein, a former long-time columnist for Barron’s, is one of the very few I have seen comment on this incredible blunder. This is an excerpt from an article he wrote in September, 2017, and is even more true today: “There could have been a bona fide trust had the surpluses generated for many years by Social Security been invested in other assets, in the same way countries maintain sovereign wealth funds. Instead, all the surpluses were spent, and IOUs known as Treasuries were created in their place. The term ‘trust fund’ is thus a form of Orwellian Newspeak: no fund, and surely no trust.” Maybe this should create another “post”, as in post-trust.
Medicare and Medicaid also have no assets, other than the payroll taxes they collect which are already falling several hundred billion short of outlays, requiring the Federal government to come up with the rest. This deficiency is almost certain to continue to grow barring significant tax increases.
Any sentient human should readily recognize none of the local, state or Federal entitlement situations are sustainable. Yet, as mentioned, even more enormously costly social programs are being proposed, on top of a “yuge” corporate tax cut that further impaired Federal revenues. This is one of the reasons, along with spending gone viral under what was a totally GOP-controlled government in 2017 and 2018, that we have a real deficit (based on what is being borrowed) of well over $1 trillion. And, of course, this excludes all of the unfunded off-budget entitlement obligations.
This terrifying situation is far more than a US problem. Globally, the retirement funding shortfall (which some refer to as “the savings gap”) amounts to $70 trillion—and that was back in 2015. By 2050, this is projected to be $400 trillion. As in America, the demographics are daunting. Worldwide there are now 600 million souls over 65 years old. By 2050, that age cohort is projected to rise to 2.1 billion. The inescapable reality is that the planet’s pension systems were built under the assumption that people would live roughly 15 years in retirement; instead, more and more are living 30 to 40 years after retiring.
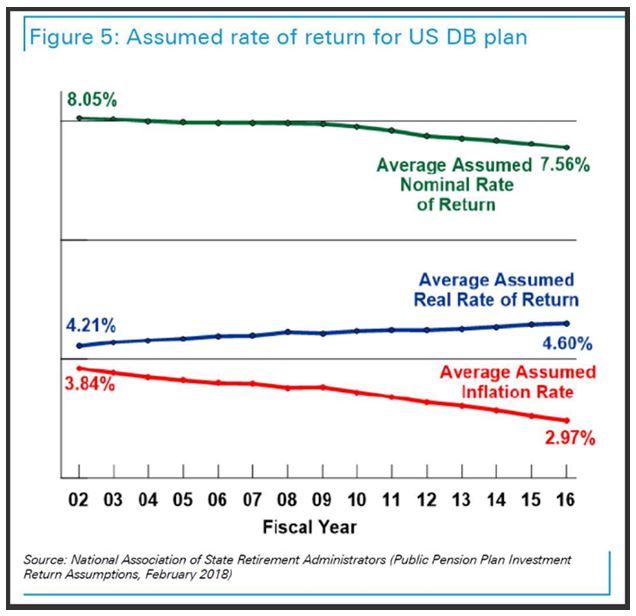
As bad as all of the foregoing is, the actual predicament might well be worse. This is where the repercussions of Bubble 3.0 come into perverse play and it relates to the previously mentioned unrealistic return assumptions. As you can see below, per the National Association of State Retirement Administrators, the assumed rate of return for US defined benefit (DB) plans has been reduced by a miniscule ½% over the past 17 years, from 8.05% to 7.56%. And because projected inflation has been reduced even more, the assumed real return is actually higher than it was in 2002 when corporate bond yields were in the 7% to 9% range and US stocks were yard-sale cheap. Can you say nonsensical?
The main theme of “Bubble 3.0” Chapter 5, “The Biggest Bubble Inside the Biggest Bubble Ever”, was the inarguable fact that bonds are the most expensive—hence, they are the lowest yielding—of all-time. The very first chart in this chapter showing yields at a 5000-year low should be all the proof needed to validate that view. If you need more, consider that there are now over $13 trillion of bonds around the world with negative yields. For instance, you need to pay the German government nearly 0.40% per year to use your money for 10 years. (Astute EVA readers may notice that the total of negative-yielding bonds has been relentlessly rising this year.)
The government of Austria recently decided to generously pay a princely positive yield of 1.1%—if you are willing to hold a 100-year bond! Even in the US, the last bastion of yields somewhere around the inflation rate in the developed world, the 10-year treasury note recently tumbled below 2%. As a point of reference, during the worst days of the Great Depression the lowest this return hit was 1.9%.
Invariably, when I’ve discussed the topic of negative-yielding bonds with clients, I’m often asked a simple and rational question: Why would anyone buy a bond where the lender pays the borrower? To answer that question, I’ve included a brief excerpt from one of my intellectual heroes, Charles Gave, on precisely this topic.
To wit: “When meeting some clients a few weeks ago in Amsterdam, I made my usual remark about the stupidity of running negative interest rates. In response my host told me a sobering story. He manages a pension fund and had recently started to build large cash positions. One day he was called by a pension regulator at the central bank and reminded of a rule that says funds should not hold too much cash because it’s risky; they should instead buy more long-dated bonds. His retort was that most eurozone long bonds had negative yields and so he was sure to lose money. ‘It doesn’t matter,’ came the regulator’s reply: ‘A rule is a rule, and you must apply it.’
Thus, to ‘reduce’ risk the manager had to buy assets that were 100% sure to lose the pensioners’ money.”
(If you’ve got the time, you should read Charles’ full piece; it’s only a little over a page long and it describes how negative-yielding bonds are a cancer eating away at Europe’s entire savings industry, with truly disastrous long-term implications.)
Because bonds are such a vital part of retirement plans, this yield extermination is an unmitigated disaster for these schemes, as the Brits call them. The same is true for those 600 million 65-and-over investors. Income from fixed-income investments has been a mainstay of portfolios since the end of WWII, if not even earlier. Neutering yields from bonds has essentially created a massive wealth transfer to hedge funds, private equity firms, and all those entities that can afford to take on high risks, and away from retired and wanna-be retired investors (who are “gonna, wanna” for a lot longer thanks to yields gone missing). Further, hedge funds, et al, typically use leverage to goose their gains. And, of course, US corporations have also “debted up” to buy-back shares, inflating stocks prices and senior management option packages.
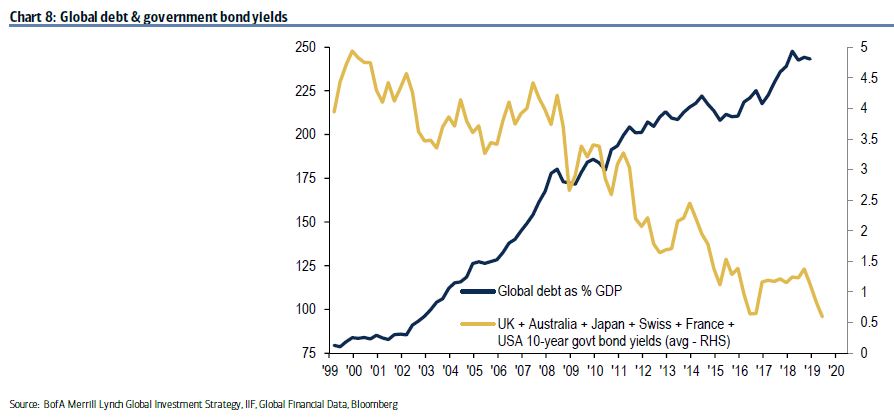
As you can see below, the world has been on a debt bender that is without precedent. Go figure—central banks destroy interest rates and the planet gorges on debt! Who knew?
Ok, so it’s LCD clear that fixed-income should be renamed nixed-income and can’t be counted on to produce anything close to normal yields for years to come. So then it’s up to the stock market, real estate, and alternative investments like private equity to bring home the bacon or, perhaps these days, the veggie burger. The problem is that all of these asset prices have already been driven up to levels where future returns are highly likely to be disappointing. (This is more true in the US than overseas, where stock and real estate values are often much more reasonable but, paradoxically, bond prices are much higher than in the States.)
If you don’t believe me on the disappointing return part, the prestigious market analytics firm Ned Davis Research has back-tested Warren Buffett’s favorite long-term stock valuation metric, total capitalization compared to the size of the economy, over the past 94 years. In their words, “no indicator we’ve tested has done better than this historically when looking out 5 to 10 years”. The sobering news is that on this basis they project stocks to produce a string-bikini skimpy 1.4% over the next decade. (In fairness, Ned Davis Research in bullish on the near-term market direction.)
A bit more encouragingly—but not much—the late and very great Vanguard founder Jack Bogle predicted a lowly 3 ½% annual return over the upcoming 10 years from a blended stock/bond portfolio. And that was back in 2017 before prices moved even higher, which lowers future gains. Consequently, the miniscule Ned Davis number for stocks could be close to the mark.
With the trillions of dollars from return-starved pension plans flowing into private equity, it’s hard to believe that area will be able to provide its historically high returns. For a time, that might not be apparent as they are presently able to sell businesses they took private years ago into a hyperventilating US new-issue market, realizing big profits. But that window won’t stay open indefinitely. Too much money chasing too few superior opportunities has never ended well in the past and I don’t expect it to this time, either.
To close this chapter of Bubble 3.0, I’d like to attempt to drive home the point that the entire paradigm of central banks forcing interest rates down to nothing, or less than, is a dagger to the heart of retiring Baby Boomers around the world. Not only are their portfolios almost certain to produce inadequate returns to maintain their lifestyles—unless they are wealthy in the extreme—their pension plans are also at risk. Benefit cuts are nearly inevitable though, undoubtedly, politicians will do all they can to delay the reckoning, thereby worsening the eventual pain.
A lack of safe returns and the escalating threat to pensions (as well as healthcare benefits) is a terrible double-whammy. Consequently, the odds are high that the golden years will be anything but for tens, even hundreds, of millions of people. Perhaps that’s why the percentage of Americans aged 55 to 64 who are still working has risen from 56% in 1990 to 65% today. It’s a pretty safe bet that number will keep climbing once we have the next bear market and Boomers are left with the worst of both worlds: a devastated equity portfolio and interest rates on high quality bonds that converge with the rest of the planet (i.e., close to zero or even below).
One wise man, quoted by my friend Danielle DiMartino Booth, believes that over the next decade one-third of those turning 65 will be in poverty. If so, it’s hard to believe all these folks, and even those that are one or two rungs up on the wealth ladder, will be free spenders. More probable is that they will hunker down and seek to save every dollar, pound, yen or euro they can. Maybe that’s one reason—in addition to all of the central bank meddling—why bond yields are telling a story of an economy on the edge of something much more serious than a garden-variety recession. After all, in the US, the Fed has actually been a net seller of hundreds of billions of treasuries over the past two years at the same time that the Treasury itself has been another seller of close to two trillion of new bonds. Thus, a lot of somebodies with a lot of money are buying all those bonds the government has been peddling. They clearly believe that either US inflation or the economy, or both, are likely to disappoint on the downside.
Should deflation fears return once again, buying a 10-year T-note at a 2% yield might look smart—for a while. That is until the powers-that-will-be, whether from the left or the right, decide to try something like Modern Monetary Theory (MMT), ejecting what’s left of fiscal prudence out the window.
What’s an investor to do? First, ignore the day-to-day noise in the financial media, fixated on how much easy money is being made in the new-issue (IPO) market and Jim Cramer’s old refrain that there’s always a bull market somewhere. Second, focus on the most important aspect: preserving your capital for the next panic. Third, shy away from what’s worked well in the market for years and concentrate on those areas that are likely to benefit when the investors wake up to realize central banks—and companies—are running out of tricks to play. Until recently, gold was a great example of that but it’s run a lot in a hurry. Longer-term, the outlook is still lustrous. Fourth, stay with intermediate-term very high-grade bonds to capitalize on what is likely to be further declines in US interest rates once the current overbought condition is worked off. (The recent jobs report, while widely viewed as healthy, actually reveals considerable weakness below the waterline. To our eyes, the US industrial sector is already in recession and layoffs are poised to rise, possibly creating a consumer recession.)
It’s definitely still possible that America experiences one of those rare but not totally mythical soft-landings. If so, some of the most depressed areas of the market may produce the best returns since investors have largely abandoned anything with cyclical exposure*. On the other hand, they are paying outrageous prices for almost everything that potentially offers the allure of high growth in a slow growth world—emphasis on potentially. As we found out 20 years ago, that’s an incredibly dangerous game to play.
Returning to the opening theme of this “Bubble 3.0” installment, it’s a most post world we find ourselves in today. Along with post-truth, perhaps another profound “post” is sanity. And, believe me, it’s no fun to be one of the few sane “guests” in an insane asylum—especially one that offers an extended stay package worthy of the Hotel California.
*Not all US cyclical stocks are undervalued these days, such as the two obliquely referred to under this week’s “Dislikes” column.

David Hay
Chief Investment Officer
To contact Dave, email:
dhay@evergreengavekal.com
DISCLOSURE: This material has been prepared or is distributed solely for informational purposes only and is not a solicitation or an offer to buy any security or instrument or to participate in any trading strategy. Any opinions, recommendations, and assumptions included in this presentation are based upon current market conditions, reflect our judgment as of the date of this presentation, and are subject to change. Past performance is no guarantee of future results. All investments involve risk including the loss of principal. All material presented is compiled from sources believed to be reliable, but accuracy cannot be guaranteed and Evergreen makes no representation as to its accuracy or completeness. Securities highlighted or discussed in this communication are mentioned for illustrative purposes only and are not a recommendation for these securities. Evergreen actively manages client portfolios and securities discussed in this communication may or may not be held in such portfolios at any given time.