
“Recession then is not about a weakening in economic activity but about the liquidations of various non-productive activities that sprang up on the back of an increase in money supply.”
-FRANK SHOSTAK, of the Mises Institute
Collision course? Have you ever wondered what causes recessions and their close cousins, bear markets? In this month’s Gavekal Evergreen Virtual Adviser (EVA), my good friends Charles Gave and Will Denyer attempt to answer that question, one that has vexed economists and even Federal Reserve officials for decades.
Embarrassingly, as noted in these pages over the years, neither the professional economic forecasting community nor the Fed itself has managed to predict as many as—drum roll, please—ONE recession. It was in this spirit that the Trump administration’s new chief economic advisor, Larry Kudlow, announced to the world on CNBC in late 2007, on the cusp of the most vicious business collapse since the Great Depression, that “recession isn’t even in my vocabulary”. For good measure, on December 4th of that year he declared: “The recession debate is over. It ain’t gonna happen. Time to move on.”
A few months earlier, this newsletter had expressed the opinion that a recession was likely in 2008. Naturally, it wasn’t a very popular prediction, to say the least. My logic at the time was related to the start of the unwinding of the massive misallocation of capital that occurred during the late, but not so great, housing bubble. By the summer of 2007, the walls were beginning to fall off the housing market edifice and it was my suspicion that its collapse would have widespread reverberations. My viewpoint wasn’t based on a deep dissection of economic data. It simply seemed to me that the wild excesses of the housing and sub-prime lending mania wouldn’t end painlessly, such as with the oft-hoped-for, but rarely realized, soft landing. Of course, it could have been just a lucky call, a possibility I readily admit. (Another admission is that I felt the recession would be mild—oops!)
Why go over ancient history? I mean, haven’t our policymakers learned their lessons from that extended period of allowing interest rates to stay too low for too long in the wake of the tech bubble’s implosion, and their failure to interdict a speculative frenzy (housing) before it got out of hand? Well, maybe not. In that regard, most EVA readers are aware we unveiled our periodic Bubble Watch EVA series with the December 22, 2017 edition. In it, we made the case—again, quite an unpopular one—that we are presently in the midst of the Biggest Bubble Ever, or what we have also called Bubble 3.0 (with tech and housing being 1.0 and 2.0, respectively).
Without putting words into his essay, I do believe it’s fair to say that Charles Gave shares our concerns that the central banks’ response to the Great Recession started out well but has gone to dangerous extremes. Charles has spent recent years highlighting the work of a long-deceased Swedish economist by the name of Knut Wicksell regarding the risks posed by either too low or too high rates.
Even before the Great Depression, Mr. Wicksell made the case that the primary cause of speculative manias—and their inevitable demise—was the level of interest rates. When rates are set below the “natural” rate (say, by well-meaning central bankers), capital becomes poorly invested. The aforementioned housing boom-cum-bust was a classic example of that unhappy sequence. The flip side is a situation such as the early 1980s, when then-Fed chair Paul Volcker drove rates well above the natural rate, inducing the worst recession—up until that time—since the 1930s. (However, at least that pain brought some serious gain, as in vanquishing double-digit inflation.)
The good news, as you will read, is that at this point neither Charles’ nor Will’s interest rate-driven models are flashing red. In Charles’ case, this is due to the big contraction in credit spreads (the difference between government and corporate bond yields) that has occurred since early 2016. This is a positive factor noted many times in past EVAs. However, it’s important to realize that interest rates have risen considerably in the US since the summer of 2016. And, very recently and very ominously, credit spreads have begun to rise, clearly breaking the downwardly sloping trendline that started over two years ago. Combined with the falling returns on invested capital (ROICs) presently being experienced by corporate America, as both of their work shows, this should, in my mind, raise at least a bit of caution.
BB-RATED CREDIT SPREADS
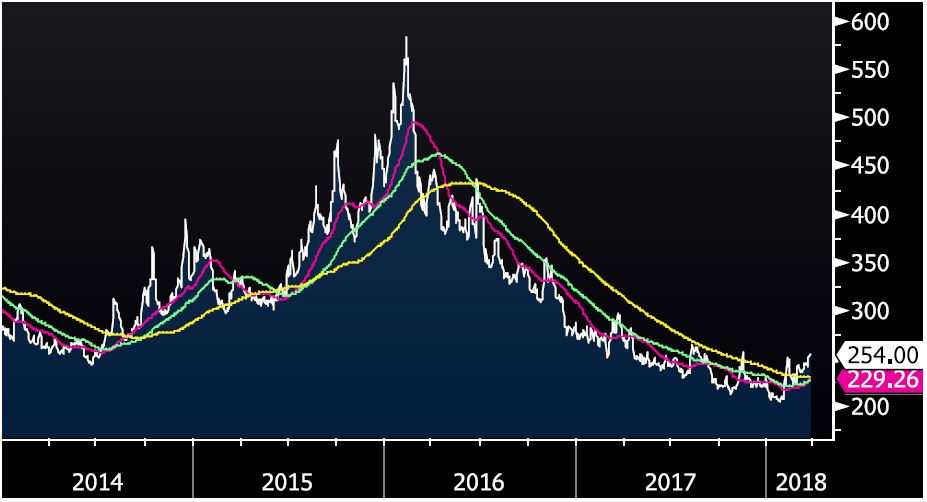 Source: Bloomberg
BBB-RATED CREDIT SPREADS
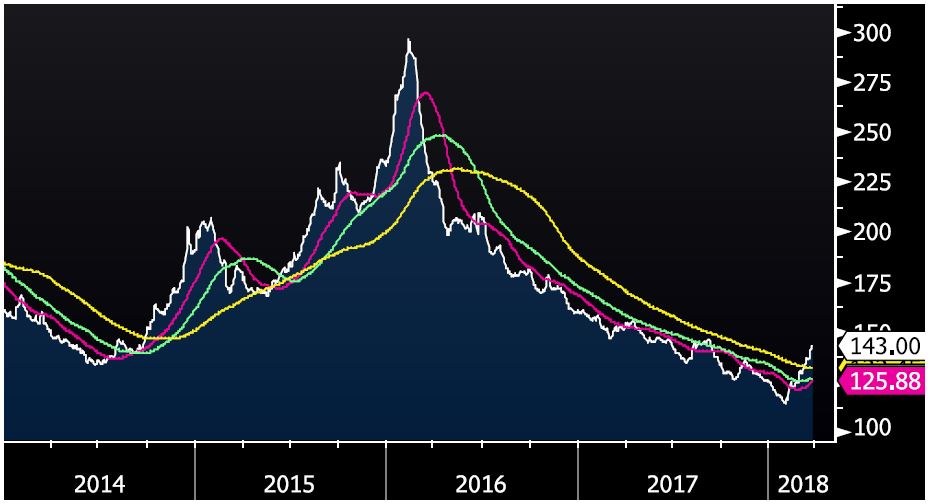 Source: Bloomberg
Will’s model now tells him to be 90% bullish on stocks after being too cautious last year. As 2017 progressed, he feared that the “longer the system operated on ‘unnaturally’ low interest rates…the more ‘damage’ might be done due to high leverage, mal-investment, and the emergence of zombie-type firms.” When you consider the evidence such as the extreme level of corporate and margin debt around today, combined with speculative binges on things like cryptocurrencies, and the proliferation of zombie companies, it seems to me he might have just been early, not wrong (a condition with which I can fully empathize).
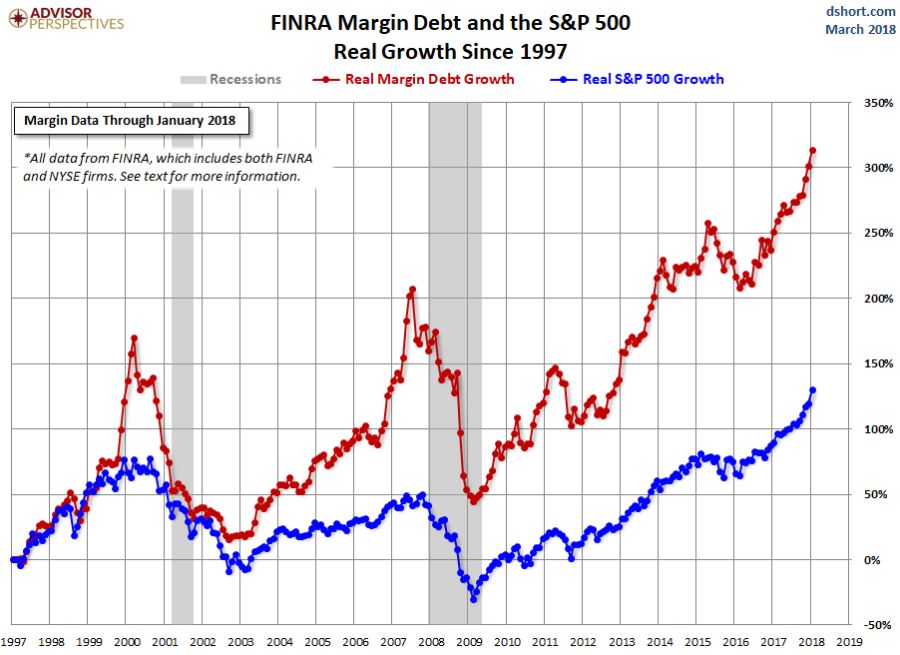 Source: Advisor Perspectives
 Source: Grant's Interest Rate Observer
 Source: Grant's Interest Rate Observer
Lastly, another element Charles incorporates with which I wholeheartedly agree is the valuation level of the stock market. A rising cost of capital concurrent with falling corporate returns is always problematic, but when it collides with one of the most expensive stock markets in history, serious damage can happen very quickly. It’s a lesson we all should have learned 10 years ago.

David Hay
Chief Investment Officer
To contact Dave, email:
dhay@evergreengavekal.com
TURNING 90% BULLISH
By Will Denyer
This piece represents both a change of view and a mea culpa. Over the last three years I have developed my own version of Charles Gave’s Wicksellian framework to analyze the US economic cycle and offer asset allocation advice. Taking a broadly Austrian view of the economic cycle, the idea has been to gauge the difference between the private sector’s return on invested capital and its cost. The latest ROIC reading for the US (4Q17) was released recently and showed only the mildest of improvements. Yet in this report, I will advise a dramatic increase in my allocation to equities. Here’s why.
A Wicksellian journey
Markets are made on the margin and thus much information is conveyed by rates of change in a particular indicator. But outright levels also matter. When developing my first Wicksellian model in 2015, I focused on the level of the Wicksellian spread, which at the time was strongly positive, and so advised investors to stay overweight equities.
In 2016, I decided it was unwise to wait until the spread turned negative before reducing risk. I worried that the longer the system operated on “unnaturally” low interest rates (expressed as an unusually wide Wicksellian spread) the more “damage” might be done due to high leverage, mal-investment and the emergence of zombie-type firms. Under such unnatural monetary conditions the system would become increasingly vulnerable to any rise in interest rates. As a result, I began to compare the Wicksellian spread to its own ten-year moving average, and disregarded its absolute level.
As bond yields shot up after the November 2016 US election, the Wicksellian spreads narrowed rapidly, crossing their own 10-year moving averages. My call was thus to underweight US equities. With hindsight, this was incorrect as shown by US equities outperforming in 2017.
Just because a model has a bad year does not mean it is faulty, but it does call for a serious review. I have done just that and decided that a compromise between my two prior approaches is needed. The level of the spread (positive or negative) should, in fact, be the key determinant of whether the model is over- or under-weight equities. Separately, marginal risk adjustments can be made when an unusually wide Wicksellian spread begins to narrow.
When re-tooling the model, I also chose to simplify it. Only one interest rate is now used (the average yield on the ICE BofAML US corporate master index), down from four. As it includes corporate debt of all maturities beyond one year, it does a decent job of capturing changes in the cost of both short-term and long-term corporate debt. As fairly poor proxies for the private sector’s cost of capital, Charles convinced me to disregard the Fed Funds policy rate and the treasury bond yield. This new single spread tends to run in the middle of my four prior spreads, making it a simple alternative.
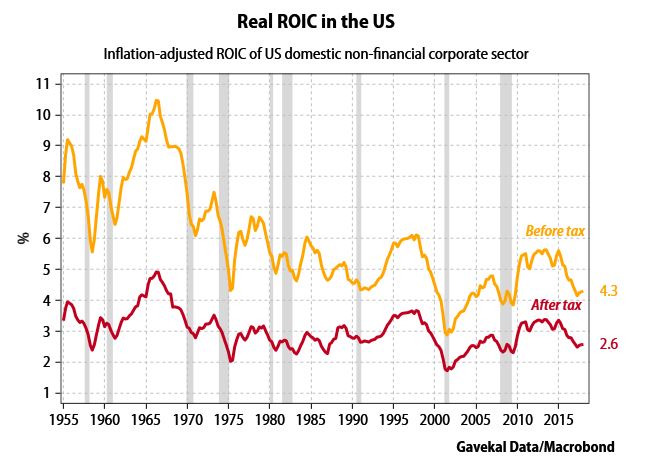
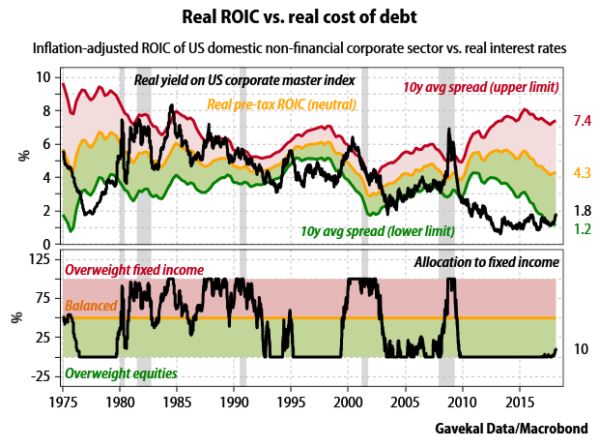
The real rate of ROIC (see chart above) comes from the US national accounts and removes “apparent profits”, which Ludwig von Mises dubbed inflationary gains that should not be distributed as they must be used to replenish inventories and capital goods at a (newly) higher price. A deflator is applied to my cost of capital measure (ICE BofAML US corporate master index) using inflation expectations from the Philadelphia Fed’s survey of forecasters.
When ROIC exceeds the cost of capital, firms should have little trouble financing growth, acquisitions or share buybacks. Which option they choose will bear heavily on the economy’s growth outlook, but in all cases equities should do well. By my estimate, the cost of capital has been well below ROIC since 2009, and remains so today. Focusing on the levels, this Wicksellian spread remains quite positive for equities.
The aim of this revised approach is to give primacy to the sign of the Wicksellian spread (whether positive or negative), while also factoring in how long this situation has persisted and dynamic changes in the level.
New set of rules
The revised rules of this model now run thus:
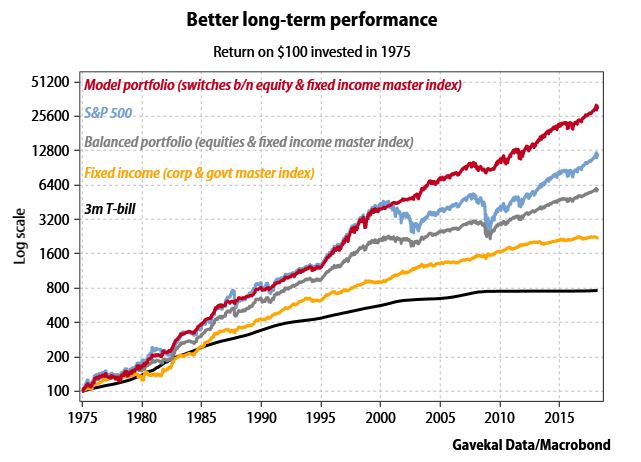
A crude back-test of this model is promising. It captured most equity rallies in the late 1990s, 2003-07, and since 2009 (including 2017!), while avoiding most draw-downs in 1987, 2000 and 2008. Today, the model suggests a 90% equity risk weighting—that means 90% of full “risk on” exposure as dictated in an individual mandate and 10% in fixed income. As investors are not earning much extra yield for taking duration risk, the duration of the fixed income part should be kept short. So today, I am 90% in equities and 10% in bills.
A (SLIGHTLY) DIFFERENT WICKSELLIAN ANALYSIS
By Charles Gave
In developing “Wicksellian” theory and applying it to portfolio management, readers may have noticed that in recent months Will Denyer and I have plowed slightly different furrows. My aim today is to clarify points of agreement and highlight differences in our methodology. In so doing, I hope to illuminate both approaches and help readers navigate our writings more clearly. A summary of my approach can be found in Investing By The (Wicksellian) Book and Will recently clarified his in Turning 90% Bullish.
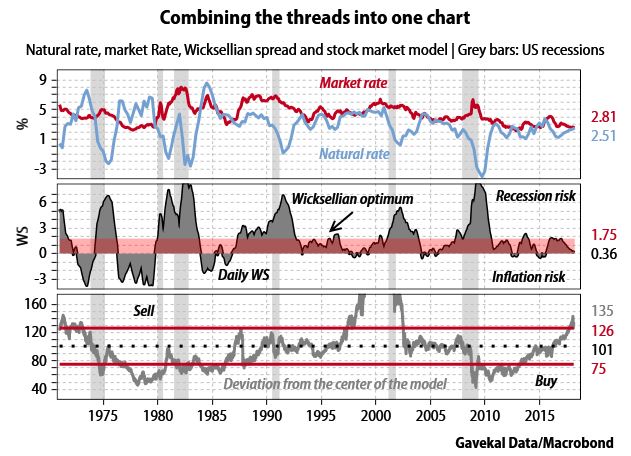
The basic theory is fairly straight forward: At any point in time a market economy can be thought of as having two essential rates of interest; namely, the market rate of interest (that rate at which companies can borrow) and the natural rate of interest (the rate at which companies “earn”).
A Wicksellian framework
There is little disagreement between us over these basic concepts. The devil, as they say, is in the details. Differences between mine and Will’s approach can be summarized as follows:
Back in the summer of 2016 I published a book that summarized all of my work on Knut Wicksell, and the application of his methods to asset allocation. Back then the “Wicksellian spread”, which had been pointing toward a US recession for the previous nine months or so, was starting to improve, as the Baa bond rate fell in real terms and the economy picked up. At that time, I told readers to sell long-bonds that were held as equity-hedges and to replace them with shorter-dated bonds. This particular call was well timed, but with hindsight it would have been better to have moved fully into equities, which at that point were fairly valued.
Today, the situation is interesting, as (i) the Wicksellian spread has lingered near a maximum bullish 30bp for a year, pointing to inflation ahead, (ii) the US bond market is overvalued, and (iii) US equities are also overvalued.
The only rational investment policy is to gradually raise cash in order to lessen portfolio volatility. The concern is if we indeed move into an inflationary period, then the stock and bond markets will become positively correlated rather than negatively linked as has been the case since the mid-1980s.
OUR CURRENT LIKES AND DISLIKES
No changes this week.
LIKE
NEUTRAL
DISLIKE
DISCLOSURE: This material has been prepared or is distributed solely for informational purposes only and is not a solicitation or an offer to buy any security or instrument or to participate in any trading strategy. Any opinions, recommendations, and assumptions included in this presentation are based upon current market conditions, reflect our judgment as of the date of this presentation, and are subject to change. Past performance is no guarantee of future results. All investments involve risk including the loss of principal. All material presented is compiled from sources believed to be reliable, but accuracy cannot be guaranteed and Evergreen makes no representation as to its accuracy or completeness. Securities highlighted or discussed in this communication are mentioned for illustrative purposes only and are not a recommendation for these securities. Evergreen actively manages client portfolios and securities discussed in this communication may or may not be held in such portfolios at any given time.