
“There’s been a breathtaking accumulation of debt in the last decade or so.”
–DYLAN RIDDLE, The Institute of International Finance
“The history of government loans is really a history of government defaults.”
–MAX WINKLER, author of “Foreign Bonds: An Autopsy”
“Financial disaster is quickly forgotten. There can be few fields of human endeavor in which history counts for so little as in the world of finance.”
–JOHN KENNETH GALBRAITH
DEBT-END
Let’s be totally honest with each other, including all of you out there under the “see no bubbles” influence. If you were to sit down and make a list of things that you never would have believed could happen ten years ago, if you included everything that has gone Alice-in-Wonderland, you’d either get writer’s cramp or carpel tunnel. No interest in doing so? Too time-consuming? Too depressing? Too confusing? Another totally — as in, I get it, so please allow me to take a crack at this exercise.
Getting tired? So am I. Accordingly, let’s file the above under that sophisticated catchphrase of “nuff said”. But you would have to be wearing rose-colored glasses worthy of Elton John not to admit this is a very strange world we find ourselves in these days. This is irrespective of a US stock market that has been continuing to make new highs, though of the less-than-impressive variety. And, as we saw at the twin peaks of last year, in January and in September, these have been produced by a limited number of glitzy stocks. Then, right on cue, stocks this month have once again hit an air pocket, just as they did twice last year.
But stocks are not what this chapter of Bubble 3.0 is all about. Instead, it’s arguably the most significant—and terrifying—feature of Bubble 3.0, that ultimate four-letter word: DEBT.
To really get to the heart of how surreal conditions have become, particularly regarding debt, let’s consider two countries. Country A runs massive fiscal deficits (i.e., its government spends much more than it takes in) while Country B maintains an essentially balanced budget, with deficits rising during recessions and producing surpluses during expansions (as John Maynard Keynes actually suggested some 80 years ago during the Great Depression; he never was an advocate of perpetual deficit spending).
Country A would normally be headed for a death spiral during which its chronic red ink would cause lenders to demand higher and higher interest rates to finance an increasingly risky borrower. This would serve as a brake on how deeply in debt Country A could get. But then let’s assume Country A was in Europe where the European Central Bank (ECB), the Continent’s equivalent of the Fed, has forced interest rates below zero. Thus, it’s possible that the more Country A borrows, the more it earns! Now if that’s not right up there with the Queen in “Alice in Wonderland” and her six impossible things to believe before breakfast, I don’t what is. (America’s current collection of political clowns leaders is another shoe-in.)
Even if the rate is around zero, or slightly above, as in the case of the former PIGS (remember that pejorative term from back in 2012?) – Portugal, Italy, Greece, and Spain – it still creates a moral hazard situation. With money virtually free, countries like Italy have no incentive to clean up their act. And that’s precisely what’s happening as it falls into an ever-deeper debt trap where its IOUs increase at a faster rate than its economy. Long-term, this a completely unsustainable situation. However, as we will soon see, there is a far more important nation that has been doing the same thing for over a decade—and its fiscal profligacy is worsening.
An example of Country B (one of the few, actually) might be Canada. It’s federal debt-to-GDP has remained relatively flat at around 30% (vs 100% in the US and 134% in Italy). Interestingly, Canada is also the only OECD country (i.e., leading developed nation) that has never engaged in central bank money fabrication, officially—and euphemistically—known as quantitative easing (QE). Canadian interest rates are positive though they’ve been pulled down to levels that last prevailed during the 1930s by the global yield crash. This has undoubtedly helped contribute to a real estate bubble in Vancouver and Toronto, along with a torrent of money leaving China. (Fascinating factoid: there are now more cranes working in Toronto than in Seattle, San Francisco, and New York City combined!).
As a result of the need to finance the enormous bubble in Canadian property prices (though it is largely confined to Vancouver and Toronto), overall debt levels in Canada are alarmingly high despite moderate federal government debt. Thus, even if a government avoids engaging in reckless fiscal (deficit spending) and monetary (money printing/negative yields) policies, it’s hard to avoid being infected by the imprudent behavior of other nations. This is especially true since the planet’s biggest economies are knee-deep in these policies of desperation.
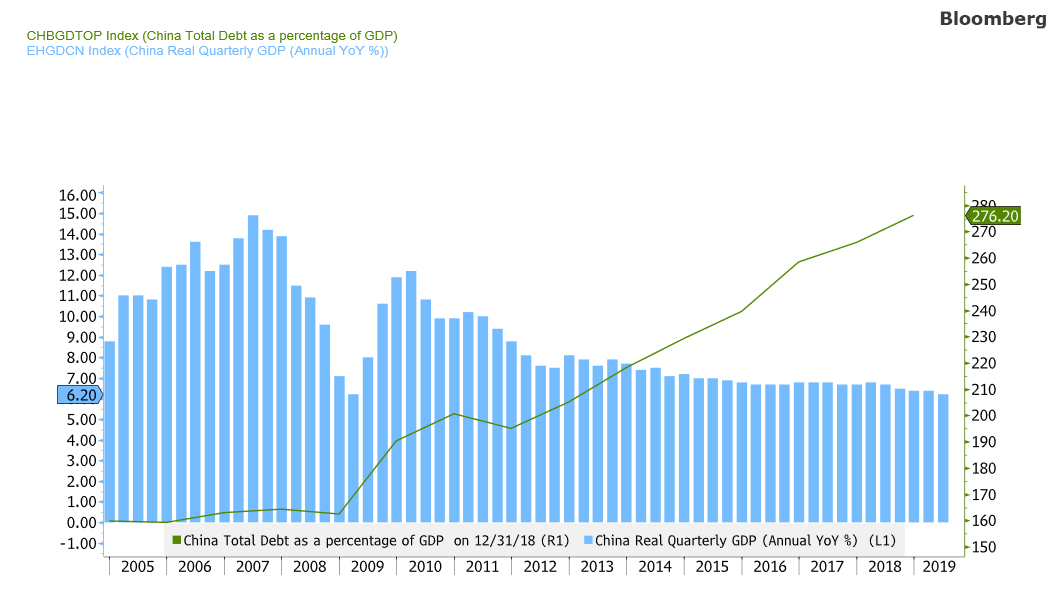
Underscoring just how out-of-control the debt proliferation situation has become, at the peak of what was supposedly the biggest credit orgy of all-time—2007—total global indebtedness was $112 trillion. Today, that number stands at $250 trillion. (note the “t’s”!) For sure, even with the punk growth seen over the past decade, the world’s economic pie has expanded. Sadly, though, it has not been anything approaching a horse race—it’s been more like a contest between a thoroughbred and a three-toed sloth. Global debt was 1 ½ times the planet’s economy back in 2007 now it is three times! Scarier yet is that the world’s IOUs have surged at seven times the rate of income growth and, of course, it’s income that needs to service the debt. Also shocking is the fact that the combined debt of the world’s four largest economies increased more than ten times as much as their economies grew last year. This, of course, includes China which has seen its total debt as a percentage of GDP rise by 75% since 2007. Note also the slowing growth (blue bars) that has accompanied this debt blow-out.
 Source: Bloomberg, Evergreen Gavekal
As my close friend and frequent CNBC expert commentator on the economy and the Fed, Danielle DiMartino Booth, has noted: “The growth of debt in the last decade exceeds the entire stock that existed before central bankers made leverage all the rage.” Please re-read that and let it really sink in—then remember this was supposed be a time of “beautiful deleveraging”. As the kids like to text: LOL!
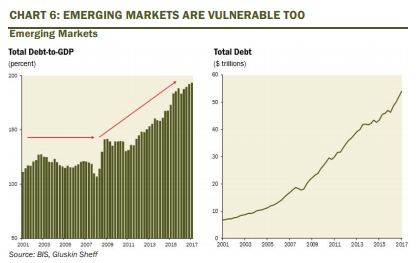
Of course, the collapse by global interest rates has made it much easier to service that debt or, in the case of the above-mentioned surreal situation, where greater debts produce greater cash flow to the borrower. While this phenomenon has mostly been driven by the “rich” countries, emerging nations have also participated in the debt bacchanal.
Then there is the previously referenced “far more important nation”, our very own US of A. Again, at the peak of the last credit bubble, total non-financial debt as a percentage of the size of our economy was $27 trillion or 225% of GDP. Today, those numbers are $51 trillion and 245%, respectively.
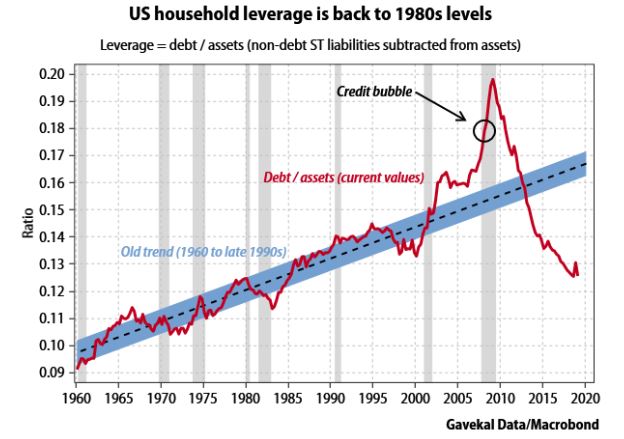
To inject one positive into what is a lengthy list of negatives, the US consumer doesn’t appear to be highly vulnerable, unlike 12 years ago. Household leverage is back to 1980s levels relative to assets though a major factor is the lofty level of stocks and real estate. Moreover, credit card and student loan debt is high but consumer IOUs don’t look like they will be the flash point this time.
Moreover, as noted in prior EVAs, the shocking federal debt numbers exclude the off-balance sheet entitlements of social security, Medicare, and Medicaid. According to Morgan Stanley, there are now around $75 trillion of funded and unfunded federal liabilities.
Yet, instead of getting spending and debt growth under control now while the economy is still healthy (though there are increasing signs of infirmity), US federal government outlays surged 30% in the most recent fiscal year at the same time that revenues fell 3%. Consequently, the Treasury is issuing well over $1 trillion annually, probably closer to $1 ½ trillion, to fund the deficit. Illustrating how bogus the government’s accounting is, over the past five years the “official” cumulative deficit has been $3 trillion while in actuality the Treasury borrowed 60% more than that, or $4.8 trillion.
This certainly should be setting off screaming sirens in the halls of Congress. Instead, the silence, as they say, is deafening. The latest debt-ceiling can-kick is yet another sorry example. The impasse was resolved by a bipartisan agreement to add another $320 billion of red-ink over the next two years. That outcome would almost be comical if it didn’t have such depressing implications for our country.
Clearly, both US political parties have lost all pretense at fiscal probity. The GOP is presiding over these trillion-dollar deficits (actual, not reported) during an economic expansion. Meanwhile, the leading Democratic presidential candidates sound like they are auditioning to be the finance minister of Venezuela.
Related to the soaring deficits, which are totally unprecedented outside of deep recessions and war, the US corporate tax rate is now just 21% vs its long-term average of 35%. However, if you dig into current corporate tax receipts as well as national income, as measured by the Bureau of Economic Analysis (BEA), the situation is much more extreme. The actual taxes paid by US corporations relative to income, as of 12/31/2018, was just 9.2% vs. the long-term average of 30.3%. A key reason government revenues have been contracting even as the economy has been expanding. The immense corporate tax cut has been a booster rocket for the stock market but what about the future solvency of the country? It’s just another manifestation of pulling out all the stops to prop up asset prices with seemingly limitless leverage.
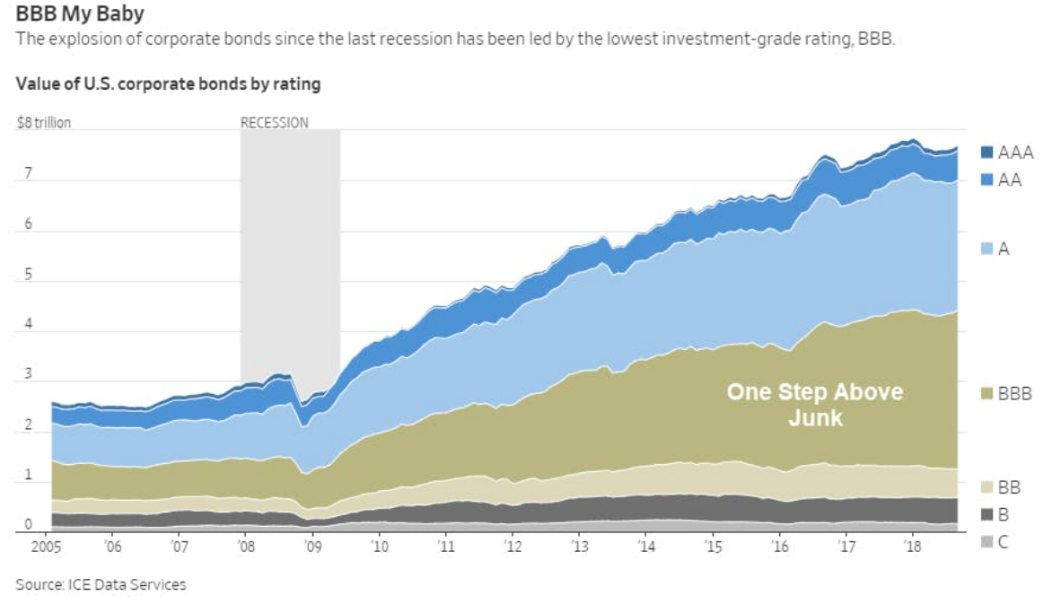
The corporate sector has been no slouch in this regard. BBB-rated debt, the level just above junk, has roughly doubled as a percentage of the size of the economy since 2007. It is now 12% of GDP and prior bubble periods don’t even come close to where we are now. This is another one of those pesky facts that indicates we really are going through The Biggest Bubble Ever, as I have often contended.
Total US corporate debt compared to the size of our economy isn’t as shocking, but it is nonetheless back up to levels that preceded bear markets and recessions.
% US DEBT OUTSTANDING COMPARED TO US GDP
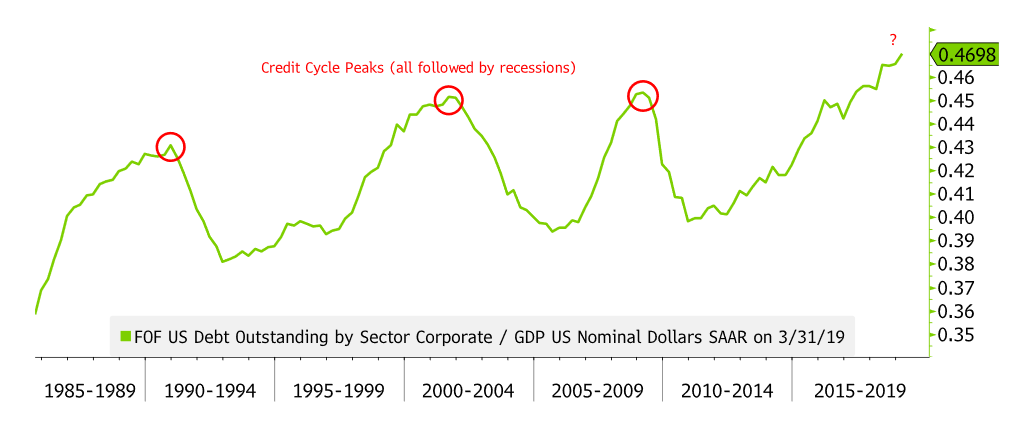 Source: Bloomberg, Evergreen Gavekal
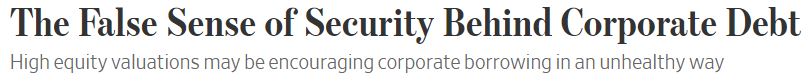
The Wall Street Journal ran this novel chart looking at debt relative to revenues. Almost every visual on corporate indebtedness looks at it versus profits, cash flow, or, as above, relative to the size of the economy. As you can see, this looks much more like the BBB-rated bond situation in terms of being way beyond the 2007 level or even 2008 when revenues plunged precipitously.
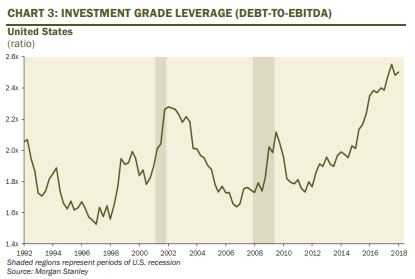
Yet, comparing leverage to earnings before interest, taxes, depreciation and amortization (the famous EBITDA or gross cash flow) measure also looks far worse than prior credit boom periods. Further, a record amount of corporate debt is coming due.

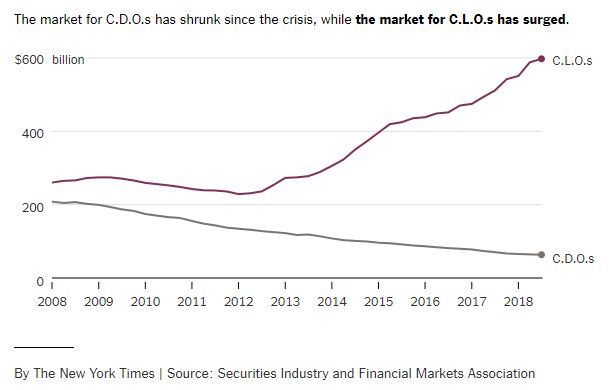
Similarly, the outstanding amount of high-risk corporate bonds and loans has also blown past the peak seen before the 2008 meltdown. Many of these are packaged into the aforementioned Collateralized Loan Obligations (CLOs). These are now as popular with institutional investors as the destined-to-be-radioactive CDOs were pre-crash. Even former Fed chair Janet Yellen said not long ago: “I am worried about the systemic risks associated with these loans”.
One might—emphasis on “might”—be able to justify this multi-trillion dollar debt binge if it was accelerating growth. But what if it was merely allowing us to run in place? Or, heaven and earth forbid, it was actually retarding growth. As my friend John Mauldin’s Charts That Matter service has shown, it’s the abhorrent latter situation that has become reality, or more accurately, surreality.
Regular EVA readers may recognize that this is what my partner Charles Gave has long been predicting. The 2006 Nobel laureate in economics, Edmund Phelps, is singing from the same hymn book. In an October 30th, 2018, Wall Street Journal op-ed titled “The Fantasy of Fiscal Stimulus” on precisely this topic he wrote: “Big deficits did not speed up recoveries. In fact, the relationship is negative, suggesting fiscal profligacy led to contraction and fiscal responsibility would have been better.” (Emphasis mine)
Economist extraordinaire David Rosenberg chimed in on this subject in his July 24th, 2019, Breakfast with Dave: “So what we find is that in the past two decades, a NEGATIVE correlation between the federal debt-to-GDP and real economic growth has emerged to the tune of -22%...As my good friend Lacy Hunt would say, ‘take note of those minus signs!’”. Minus signs indeed, but how often do you hear a free-spending politician bring this up? How about never?
Another question: Why is it that high levels of debt inhibit, rather than enhance, economic activity? The legendary market strategist, Ned Davis, provided an answer in his December, 2018, “Quarterly Debt and Savings Update”: “Thus, excessive debt is a burden on growth through: (1) debt service; (2) repayments; (3) low credit scores (people less ‘credit worthy’); (4) anxiety of being trapped by debt.” He has found that consumer income growth is over twice as fast when debt levels are low vs when they are high, let alone record-breaking as they are today.
In my opinion, a rapid and gargantuan mushrooming of government debt also inhibits economic growth by pulling resources away from the far more productive private sector and transferring it to the malinvestment-prone public sector. Undoubtedly, a lot of it comes back to the private sector in the form of welfare payments, salaries, highway projects, etc. But most of it is consumed rather than invested. And, unfortunately, even when it comes to real investments like infrastructure build-outs, the amount of waste is appalling (the huge cost-overruns seen on major construction projects in the State of Washington is one glaring example). Over time, this creates a significant drag on the economy’s structural growth rate. (It’s interesting that despite moderate government deficits and avoiding QEs, Canada’s growth rate has been roughly the same as the US this decade; further, the US enjoyed some of its best economic times in the late 1990s when it was running budget surpluses).
Even in the private sector, the ability to attract easy and cheap capital has a dark side, especially when it’s debt vs equity financing. Consider the overinvestment and wild borrowings in real estate that occurred leading up to—and almost certainly causing—the Great Recession. Given how long money has been oversupplied and underpriced this decade, it’s a virtual certainty that there is a plethora of stupid investing going on these days, even in the private world. Once these blow up, as they always do, the losses incurred will significantly impede future economic expansion. Basically, when investors wake up one day and realize that, in many cases, what they owe exceeds the value of whatever they borrowed against, the you-know-what hits the fan blades. At that point, it’s a classic case of debt deflation.
Another example of this is stock buy-backs which are often funded with debt. These increase earnings per share but they often reduce actual profits due to the related interest costs. This type of financial legerdemain works wonderfully in a bull market but is a kick in the groin in bear markets and recessions. Charles Gave recently wrote on this topic: “The effect of mispriced capital over the last decade or so has led to debt-funded financial engineering, and not to fresh capital investments.”
He’s making a key point that if money is too cheap, facilitating a widespread leveraging up of existing assets, it crowds out investment in productive areas like research and development. Every decision by corporate executives to buy-back shares rather than invest in growth initiatives, reduces future productivity. Certainly, sometimes it makes more sense to buy back shares – if they are compellingly cheap and offer higher returns than by, say, building a new plant or buying a robot. However, for most US companies buying their own shares hasn’t been value-enhancing for years due to how expensive they’ve been. (In a recent interview with one of our team members, the CFO of Costco said they are no longer reducing their shares outstanding due to its lofty stock price, showing admirable discipline that most management teams lack.)
The irony for central bankers is that their tsunami of pseudo-money has incentivized the above described financial engineering over real engineering. This is likely why productivity improvements—almost the only way an aging society like the US can accelerate growth—have been running at just 1.3% per year since 2007, less than one-half of its pre-crash pace.
The truly disturbing aspect is that central banks like the Fed and the ECB are now conceding their tool kit is basically exhausted. (Admittedly, the Fed has more monetary maneuvering room than almost every other “rich world” central bank, excluding the Bank of Canada.) This was the central theme of the Bubble 3.0 chapter “No Way Out” from back in February. Thus, what this is leading to is a doubling—or tripling—down on fiscal deficits gone wild.
While the media frenzy over Modern Monetary Theory (MMT) has subsided since last spring, the shift toward it remains nearly inexorable. In fact, as brainy Ben Hunt has noted in his provocative Epsilon Theory newsletter, “we’re all MMT’ers now”, a phrase I coined back in our April double edition on MMT. If this surprises you, think about what’s been happening in America in recent years. A cornerstone of MMT is that as the government spends far more than it takes in, the Fed should buy the deficit-funding bonds. This is known as debt monetization and was once thought to be reserved for hyper-inflationary banana republics.
Yet, that’s exactly what the Fed did for most of the past decade, monetizing nearly $4 trillion of treasury bills, notes and bonds. Starting last year, it has tried to gradually reverse this MMT-like effort. However, along with cutting rates last week, the Fed announced the end of the QE reversal, known as quantitative tightening (OT). Sadly, it was only able to unwind about $730 billion of the QE total.
With the real annual deficit now nearing $1 ½ trillion, it’s no stretch to see this hitting well over $2 trillion in the next recession. (The US treasury yield curve* is now deeply inverted, sending a very strong recession signal.) This is likely to leave the Fed little choice but to shift back into QE/MMT mode. But the even bigger risk is that with limited rate-cutting room, and the obvious failure of even negative yields to stimulate the global economy, frantic policymakers will decide to do something extreme like doubling Federal spending almost overnight. MMT tells them they can do so as long as inflation stays subdued and, if it does, the Fed can always hoover up enough treasuries to keep interest rates from surging. (MMT advocates don’t spend much time discussing what would happen should inflation soar.)
It seems inconceivable that the federal deficit could hit $4 trillion in a not-too-distant year. However, if the MMTers have their way, we may need to conceive of it after all. It’s at 20% of GDP, currently about $22 trillion, that hyperinflation has started to emerge in countries that have allowed government spending to explode (leading the economy in question to consistently implode).
Our July 26th Guest EVA ran a summary of a 15-page essay by hedge fund titan Ray Dalio. Even though I disagreed with his “beautiful deleveraging” thesis that he espoused a few years back (he’s gone quiet on that for obvious reasons), his “Paradigm Shifts” is absolutely a must-read for all serious investors, in my view. It’s on exactly the topic of what happens when there is simply too much debt for an economy—or a lot of economies—to handle. Here’s a sample: “As these forms of easing (i.e. interest rate cuts and QE) cease to work well and the problem of their being too much debt and non-debt liabilities (e.g., pension and healthcare liabilities) remains, the other forms of easing (most obviously, currency depreciations and fiscal deficits that are monetized) will become increasingly likely.” There you have it. And with most major countries trying to force their currency down, or keep it there, it’s very hard to stimulate playing that game. That pretty much leaves the nuclear stimulus option of MMT.
If that’s what’s coming, there aren’t many protective options but as Mr. Dalio notes gold is one of them. Another is Bitcoin and the other crypto currencies, even though I continue to think they’ve been a beneficiary of Bubble 3.0 and thus are extremely rich in downside risk.
As one EVA reader emailed me last week, quoting popular financial author, Jim Rickards, one of the few to anticipate the last crisis: “Hard assets and hard work are the only stores of value”. Frankly, during this stealth MMT era most investors have been lulled into thinking all you have to do to make high returns is buy an S&P index fund. That’s been the case for most of the last ten years but, as Mr. Dalio emphatically conveys in “Paradigm Shifts”, what works in one decade almost never works in the next. In fact, whatever asset class or investment vehicle has been the biggest winner of the past 10 years tends to get smoked in the coming decade. You may have noticed this one ends in about five months.
* In other words, short-term treasury rates are higher than many longer term rates.

David Hay
Chief Investment Officer
To contact Dave, email:
dhay@evergreengavekal.com
DISCLOSURE: This material has been prepared or is distributed solely for informational purposes only and is not a solicitation or an offer to buy any security or instrument or to participate in any trading strategy. Any opinions, recommendations, and assumptions included in this presentation are based upon current market conditions, reflect our judgment as of the date of this presentation, and are subject to change. Past performance is no guarantee of future results. All investments involve risk including the loss of principal. All material presented is compiled from sources believed to be reliable, but accuracy cannot be guaranteed and Evergreen makes no representation as to its accuracy or completeness. Securities highlighted or discussed in this communication are mentioned for illustrative purposes only and are not a recommendation for these securities. Evergreen actively manages client portfolios and securities discussed in this communication may or may not be held in such portfolios at any given time.