
"Never in history have household financial assets been higher relative to the disposable personal income that must support these assets and the humongous debts behind them."
- Ned Davis, founder of Ned David Research (and a stock market bull!)
POINTS TO PONDER
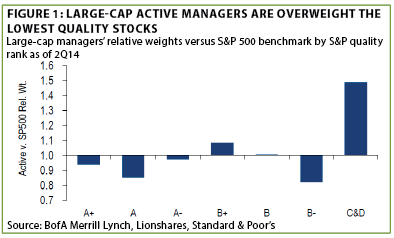
1. Even money managers who focus on large-cap stocks (i.e., blue chips) are overweight the riskiest issues, likely due to the extended period of outperformance "red chip" stocks have seen. This was also the case in 2007 (see the "Reluctant Bear" section on page 3) prior to a shellacking of lower quality equities the following year. (See Figure 1)
2. 1.6 billion years is a long time, even in geological terms, but the Treasury bond market recently produced an event last month that, according to statisticians, should occur with that approximate "frequency." The breathtakingly rapid plunge in 10-year T-note yields from 2.19% to 1.86%, and the lightening-quick move back to 2.13% on October 15th, was seven standard deviations away from normal trading activity, according to analysts. If such conditions can hit the ultra-liquid Treasury market, imagine what kind of swings will eventually engulf less frequently-traded debt securities.
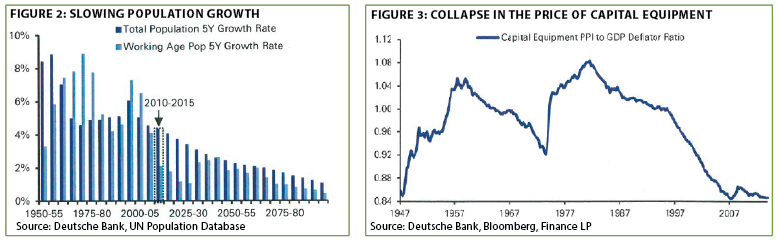
3. Economic growth is a function of both population expansions and productivity enhancements. Unfortunately, demographics are challenging, even in the US, at the same time that chronic under-investment in long-lived production assets (new machinery, infrastructure, etc) has been in a multi-year slump. Perhaps this is why, along with tech’s larger share of the economy and its constantly tumbling costs, the price of capital equipment is in a long downtrend. (See Figures 2 and 3)
4. Underscoring how severely e-commerce is impacting traditional stores, mall traffic fell nearly 15% during last year’s holiday shopping season. Based on results from this Thanksgiving’s retail sales, it looks like it could be another rough year-end for brick-and-mortar retailers.
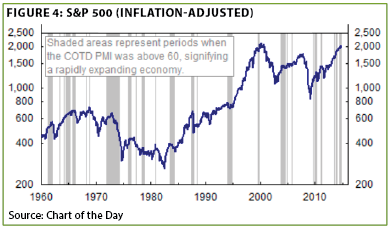
5. Ironically, past episodes of strong Institute of Supply Management (ISM) Purchasing Manager’s Index (PMI) have tended to occur just prior to sharp stock price corrections. The PMI recently broke through a threshold near 60 where negative market reactions have ensued. Fortunately, several such readings have been associated with sideways markets. The logic for this seemingly contradictory relationship is that unusually robust PMIs nearly always lead to Fed tightening. (See Figure 4)
6. One of the more encouraging aspects of recent US jobs’ reports has been the improvement in the percentage of America’s population that is working, spurting from around 58% to 59%. The negative aspect is that most of the hiring has been in the 55 to 69 age cohort, with the crucial 25 to 54 age group actually shedding jobs. Today’s jobs release, however, looks to be unreservedly positive with healthy wage growth, at least for skilled workers.
7. The eurozone was viewed not long ago as boasting the ideal blend of socialism and capitalism, but its performance in recent years suggests it overdid the socialistic aspects. Moreover, the limitations of having such diverse economies as Greece and Germany using the same currency has also played a supporting role. Whatever the cause—or causes—the once-proud Continent has fallen into a long-period of stagnation, as starkly illustrated by its share of global profits. Even the Pope has likened Europe to an "elderly and haggard grandmother." (See Figure 5)
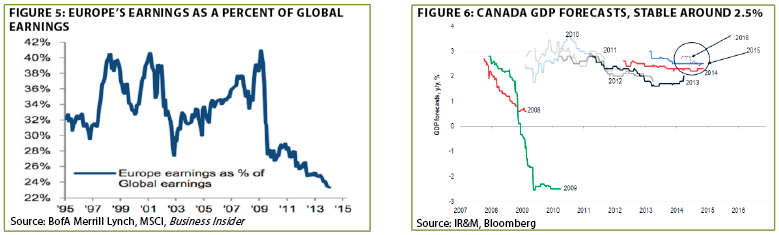
8. Canada continues to be tarred with the same brush as weaker and more oil-dependent countries. Despite this (mis?) perception, Canada’s economy appears to be gaining speed and, unlike so many other countries, forecasts for 2015 GDP growth have remained stable at 2.5%. (See Figure 6 above, right)
9. China was long exempt from the growth travails of the supposedly "rich" world. These days, that’s clearly no longer the case. Chinese factory output recently hit a 13-year low. This is highly problematic for a country that remains heavily reliant on industrial production, despite commendable efforts to move toward a more consumer-centric economic model.
10. The International Monetary Fund (IMF) recently issued a grim warning. Only 4 countries over the past 50 years have seen their debt-to-GDP ratios rise as high as China’s is today. All four subsequently either endured a recession that led to a credit crisis or a credit crisis that led to a recession.
THE EVERGREEN EXCHANGE
By David Hay, Tyler Hay, and Jeff Dicks
Overall, Evergreen believes the current bull market in US equities has gone far beyond what fundamentals can support. We’ve seen the weakest GDP recovery on record and yet we are 272 weeks into the second longest bull market in US history. Share buybacks, easy money policies, and lower taxes have all led to historically high profit margins, despite extremely tepid growth in revenues. Bulls argue that the financial stimulus we’ve felt as a result of QEs I, II, and III, are finally taking hold and economic growth will catch up with the stock market’s torrid run, but we’ve heard that story for years. We think this party will come to an end--it’s only a question of when. But, obviously, the "when" is crucial. In this edition of the Evergreen Exchange, David Hay weighs in on why it could be sooner not later, while Tyler Hay argues that it’s not likely to occur during 2015. Finally, Jeff Dicks will analyze the recent divergence between stocks and credit spreads, and will discuss what this could mean for the current bull cycle.

Reluctant bear. Talk about typecasting! In days of old, like way back in 2011, yours truly was pigeon-holed as a perma-bull. Now, I’m totally classified under the ursine species (that would be a bear, for those of you who didn’t major in zoology).
Accordingly, in this edition of the Evergreen Exchange, I have been assigned the unpopular, though familiar, task of warning why this stock market could be headed for trouble. But before I do, I’d like to make it clear I do believe that, as Tyler notes in his section, crumbling crude prices are clearly good news for America. This is despite the reality that it’s not as super-bullish as it once was because our domestic energy sector was arguably the most dynamic and robust prior to oil going reverse-postal. In fact, if you exclude Texas, America has actually lost jobs on balance since 2007, or prior to the Great Recession.
Yet, the US is predominantly a consumer-driven and service-oriented economy so lower energy costs are still a positive. The problem is that almost everyone in the investment community is jumping on that band wagon. This raises the odds forecasts of a market melt-up may be in the process of coming true, setting the stage for an even worse shakeout down the road. (More to follow on this theme in next week’s EVA.)
"Everyone," that is, except for a hardy band of skeptics who, unsurprisingly, includes me. As I’ve noted in past issues, it amazes me how almost every market pundit who was warning about the dangers back in 2006 and 2007 is doing so again. This was reinforced to me when I was cleaning out one of my research files a few weeks ago and came across an especially relevant Fortune magazine article. It was written on September 5, 2007 by the iconic Jeremy Grantham, co-founder of $120 billion money management firm GMO.
The piece was titled "Danger: Steep Drop Ahead," and he wasn’t forecasting the weather in Boston, where GMO is based. Rather, he was talking about the two most important asset classes for most investors: housing and the stock market.
The first half of the article presciently outlined his case for why he felt housing was a disaster in the making. Really long-time EVA readers know that I was equally as bearish on residential real estate in 2007 and, as usual, had been premature in my disdain (see here). These days, neither Mr. Grantham nor I are terribly concerned about the US housing market (though I will say, this headline in Tuesday’s Wall Street Journal, "Dodgy Home Appraisals Make a Comeback," did raise my old housing bubble antennae a bit).
But his worry points about stocks in September 2007, after roughly five years of steady gains, could almost be copied and pasted into a current article. In fact, if it weren’t for fears of being a shameless plagiarist (even more than usual), I would do exactly that. Instead, here are a few choice excerpts:
You’ve got to admit the foregoing sounds remarkably similar to current conditions. It’s important to note, though, that stocks didn’t immediately tank in 2007, they started to wobble but stayed close to their highs well into 2008. But, of course, once they did break, it was catastrophic.
Numerous prior EVAs have quoted GMO’s long-term forecasts for stocks projecting negative returns for most parts of the US stock market over the next seven years (coincidentally, this synchs with Jeff Dicks’ credit spread analysis in his section on page 6). The chart below shows why—in addition to Mr. Grantham’s extremely timely warnings back in September, 2007—you might want to pay attention to what he and his firm are saying today.
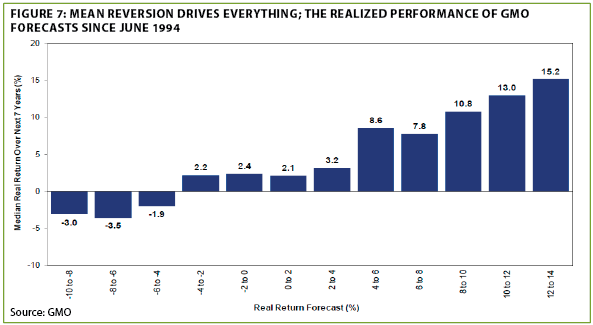
As you can see, what GMO predicted in the past has come commendably close to reality. Even though they were often off in the magnitude, they almost always got the basic direction right. So, if they were forecasting negative returns for an asset class, it either did generate red ink or produced very low positive returns. Similarly, those that they projected to have high returns, did in fact deliver. (Note that this goes back to 1994.)
Interestingly, Jeremy Grantham is among those believing a climactic surge is probable for stocks, along with GaveKal’s Anatole Kaletsky, to be followed by a bloodbath. As I mentioned at the beginning of this section, lower oil prices could provide the catalyst for that final frenzy. If so, expect the party to hit a feverish crescendo sooner, rather than later—and the morning-after hangover to be even worse.
![]()

Political Backdrop
In June of 2012 at a conference in Arizona, Greg Valierre, Chief Political Strategist for the Potomac Group, called Barack Obama the earliest lame duck president in history. The midterm elections confirmed his viewpoint as the president’s approval rating has dropped to the previously inconceivable levels seen by George W. Bush during the Iraq war. Don’t expect anything to change before the 2016 election—but that may be a distinct positive for stocks based on how well they’ve done since 2012 with gridlock in D.C.
Republicans are likely holding out for a presidential victory giving them a mandate by controlling the House, the Senate, and the Oval Office. Reaching any serious compromise with a democratic president would give Mr. Obama a rare feather in his cap and allow him to tout his party’s ability to reach across the aisle in cooperation. Accordingly, the GOP is unlikely to be accommodative. Within his own party, he has become politically radioactive. Any democratic lawmaker willing to partner with the president would likely hear about it from party leaders, who are scrambling to stop the bleeding in the Senate and the House.
The net result of the political environment in D.C. for investors can be summed up as more of the same. Needed reforms—such as immigration, tax code simplification, and unaffordable entitlement commitments—-will remain untouched until 2016. So, no news is good news for the stock market as it’s hard to see anything coming out of Washington with enough magnitude to catch investor off-guard (even if, like so many things, what’s good for the stock market may not be good for our nation’s long-term welfare).
Federal Reserve
The Fed is at a crossroads. After five years of experimental monetary policy moves, the US economy seems to be showing modest signs of strength. Fed officials have almost all signalled that measured rate hikes will accompany sustained economic progress. Obviously, sustained economic progress in 2015 would likely mean positive returns for the stock market. But how would the Fed handle some type of negative surprise? I believe they would quickly return to their bag of QE tricks and announce further easing. Supporting this viewpoint, Fed Governor Bullard—who is generally more hawkish—came rushing to the rescue during the market’s minor hiccup in October. If a minor drop in the stock market causes one of the Fed’s less-than-dovish governors to quickly put easing back on the table, what would it do if a more serious event took place? (Hint: It starts with Q and ends with E.) Consequently, the so-called Fed put is alive and well, another supportive factor for stocks.
Declining Commodity Prices
Falling oil prices have emerged as an unexpected tailwind for consumers. In the US, gasoline prices for automobiles have declined over 20% or the equivalent of a $75 billion tax cut to households. While the decline in oil has grabbed most of the headlines, the bulk of commodities are falling as well. Tin, copper, soybeans, nickel, rice, iron ore, and coal are trending lower suggesting further relief for consumers. In fact, commodity prices as a whole fell below their four-year lows in September. Clearly, there is a fundamental question posed by the weakness in commodities: Is this temporary weakness or a secular decline reflecting chronic global economic stagnation? But regardless of your conclusion, it’s hard to deny the stimulative effect of lower prices.
Improving Economic Metrics
While the quality of the jobs is of some debate, few can argue that we haven’t seen a tightening of the US labor force. Further, GDP growth is respectable, although not exactly skyrocketing, while corporate profitability is scintillating (even if heavily driven by non-operating factors like share buybacks and lower interest rates). While I’m not suggesting the economy is on a roll, it’s at least been strong enough to cause the cessation of the Fed’s bond buying program—for now. There’s also been modest progress in reducing our Federal debt despite (or because of?) the continued dysfunction in the Capitol.
Summary
In my opinion, we haven’t seen the type of vibrant economic growth following the financial crisis to warrant the stock market’s white-hot returns. However, given the backdrop I’ve outlined above, I don’t believe the odds favor the music stopping in 2015. I do caution investors that this isn’t a ringing endorsement of US equities, because I think the risk/reward profile for the market greatly favors safety, with an emphasis on the long-lagging blue chip issues. It’s my belief that while the probability of a positive return for stocks is north of 50%, I think the potential downside for stocks is far greater than the remaining upside. Said another way, those investors reaching for the last profits out of this market are picking up pennies in front of a steamroller.


When opposites attract. For a technical spin, let’s explore a few discrepancies occurring in the financial markets and their potential impact on future stock market returns. Specifically, we will be looking at the stock market’s relationship with high yield credit spreads (the difference between the interest rate on junk and government bonds)—one of the most widely used leading indicators. Historically, these metrics have displayed a tight, negative correlation. Translation: As stocks go up, credit spreads tighten (or go down). And, as stocks go down, credit spreads widen (or go up). This should make intuitive sense; if we think about an individual company, as earnings and revenues grow faster than expected, the stock will go up as investors digest the good news. Meanwhile, the debt is perceived as less likely to default given the excess cash flows that can be used to cover debt payments. Consequently, the yield spread between treasuries (risk-free) tightens as investors require less of a premium for their investment. To illustrate this relationship, check out the chart below:
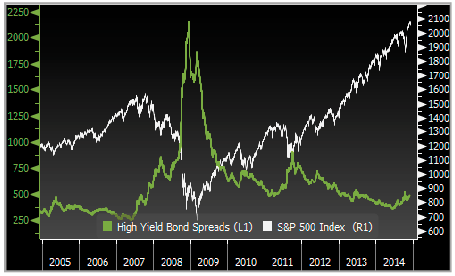
Since June, high yield (HY) credit spreads have widened by over 100 basis points (1%), while the S&P 500 is up 6%. Therefore, bond investors and stock investors are saying opposite things when it comes to market risk. HY bond investors see the market as more risky, but stock investors continue to buy. The following chart displays the recent positively-correlated trend:

What happens when this historically consistent relationship breaks down? We analyzed the last 20 years of data and looked at any period where both credit spreads were up at least 100 basis points and stocks were up at least 5%. We then looked at the subsequent market returns from those points to get a clearer picture of future returns. Here is what we found (See table below):
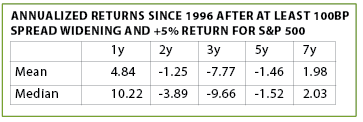
Based on this historical evidence, projected future returns are dismal with the exception of one year. This means when the data shows a divide between bond and stock investors, bond investors tend to be right over the long-term. Still, stock investors do tend to benefit during the first year periods. Perhaps it’s because finance professionals largely influence the bond market, while the stock market is more retail-driven. Or maybe equity investors are more short-term oriented than bond investors who tend to "think towards maturity." Whatever the reason, when this signal has flashed red in the past it’s been an accurate alert for long-term investors to steer clear of riskier investments. This warning sign would have helped protect your portfolio in both the late ‘90s and during 2007 and it’s clearly in the danger zone now.
So what does this all mean? This particular data supports Tyler’s thesis, stocks certainly could go up for the next year. But based on recent history, you’d be locking in very poor long-term expected returns. We tend to side with bond investors in terms of looking at a longer investment horizon to maximize returns over a complete market cycle. Narrowing credit spreads has been one of the main engines of this stock market express but now that locomotive is running out of steam.

Important Disclosures
This report is for informational purposes only and does not constitute a solicitation or an offer to buy or sell any securities mentioned herein. This material has been prepared or is distributed solely for informational purposes only and is not a solicitation or an offer to buy any security or instrument or to participate in any trading strategy. All of the recommendations and assumptions included in this presentation are based upon current market conditions as of the date of this presentation and are subject to change. Past performance is no guarantee of future results. All investments involve risk including the loss of principal. All material presented is compiled from sources believed to be reliable, but accuracy cannot be guaranteed. Information contained in this report has been obtained from sources believed to be reliable, Evergreen Capital Management LLC makes no representation as to its accuracy or completeness, except with respect to the Disclosure Section of the report. Any opinions expressed herein reflect our judgment as of the date of the materials and are subject to change without notice. The securities discussed in this report may not be suitable for all investors and are not intended as recommendations of particular securities, financial instruments or strategies to particular clients. Investors must make their own investment decisions based on their financial situations and investment objectives.