
"Watching neighbors get rich at the end of a bubble while you sit it out patiently is pure torture."
- Jeremy Grantham, co-founder of $117 billion money manager GMO
He who laughs last, laughs best. We all have our secret aspirations, right? In my case, I’ll admit that one of mine is to someday be invited to be a member of the Barron’s Roundtable. Yes, I know that is about as likely as Bill or Hillary Clinton giving a speech for free. (Wouldn’t it be nice to be "broke" like them?) But I can dream, can’t I?
For those unaware of this meeting of marvelous minds, the Roundtable has been in existence since at least the 1980s, and it has included some of the most legendary money managers of all time, including Peter Lynch and Bill Gross.
In last week’s EVA, I quoted a few excerpts from a man who is living the dream—at least my dream—Fred Hickey, a current member of the most famous roundtable this side of Camelot. Fred has published his storied investment newsletter, The High Tech Strategist, since 1987. The market historians among you realize that was a most interesting year (one that I continue to believe might resonate at some point in 2014).
Fred is far from your apocalyptic gold-bug. In fact, as the name of his newsletter indicates, technology is his main focus. However, years of ill-advised US fiscal and monetary policies have, like me, turned him into a reluctant holder of bullion as protection against said "emergency measures." As Milton Friedman long ago noted, there’s nothing quite as permanent as a temporary government program. His observation rings particularly true with red ink and free money continuing to spew out of Congress and the Fed even years into an economic expansion.
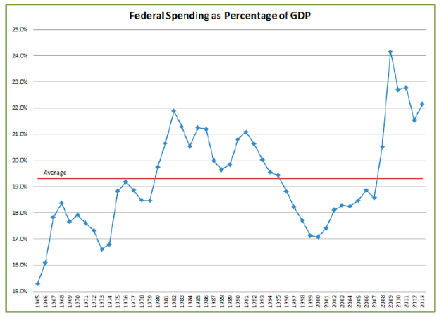
On the fiscal or budgetary score, I thought the chart below was most telling. Despite worries about "fiscal drag" and "austerity," federal spending as a percentage of GDP remains at levels previously associated with recession troughs. Further, as you can see, the much-ballyhooed deficit shrinkage has failed to bring this ratio anywhere near where it was late in prior expansions, even during the Reagan military build-up years. If this is austerity, I’d hate to see what profligacy looks like!
On the monetary side, notwithstanding what most economists feel is a mediocre-to-decent economy, and whiffs of inflation in the air, our enlightened Fed is convinced it must continue to maintain a much more stimulative monetary stance than we’ve had in any contraction, including the Great Depression.
Yet, in spite of the twin terrors of irresponsible fiscal and monetary policies, the obvious beneficiary of this lusty largesse—gold—continues to languish in the investment equivalent of an old Soviet gulag. Consequently, we have another one of those "Great Disconnects" that past EVAs have frequently highlighted.
As you will read, Fred makes a strong case for why the divergence between the price of gold and its fundamentals is unlikely to continue. And, per last week’s EVA, the spring of 2013 saw a panic in gold, that flushed out most weak-kneed western retail investors and precipitated a massive eastward migration of the yellow metal into the hands of much more dedicated holders. (Also, please note his comments on page four about our favorite market valuation metric, the price-to-sales ratio.)
You will further see that Fred took a lot of heat for being negative on tech stocks back in the late 1990s, similar to what I went through during that most maniacal of all manias. These days, he’s once again being ridiculed, this time for his belief that gold might be undervalued during our present pandemic of fiat currency replication. Somehow, I suspect that Fred will have the last laugh, just as he did after tech performed its catastrophic face-plant.
One final note is that Fred’s monthly letter is remarkably affordable at just $140 annually for the email version. You can sign up to receive it by emailing thehightechstrategist@yahoo.com. He is currently also offering a 90 day trial for $60.
Take it away Fred!

RUNNING OUT OF TIME
By Fred Hickey
The High-Tech Strategist, originally published 6/3/14
With this June newsletter, I have now completed 27 years of writing The High-Tech Strategist. I started this newsletter in July 1987 so next month’s letter will be the start of year 28. It’s been quite a ride. I owned tech stocks almost exclusively for twenty consecutive years, ever since my first purchases of Wang Labs and Prime Computer in 1979. Those two stocks and several other early tech stock purchases that followed ended up as spectacular percentage winners. I quickly caught the investing bug. Unfortunately, by the end of 1998 I had to sell my last remaining tech stocks (out of necessity). I was forced out by the actions of the Greenspan-led Fed which, through its constant interventions and easy money policies, had created a bubble in tech stocks of unprecedented proportions.
As I knew, that bubble was doomed to burst. I put most of my money in short-term (1-year) treasuries yielding nearly 6%—considered to be a pittance at the time given the opportunities that nearly everyone else saw from the "new era" internet world (but a rate I’d give my right arm for today). I also built up longer-term put options positions against tech and internet stocks. The next two years were extremely difficult. The wait seemed interminable. I had to re-load put options against tech stocks that had expired. It’s not an easy thing to do when nearly everyone (except for a few hard-core compatriots) believed otherwise. Long-term readers from way back know that I was taunted, teased, and called every name in the book. I was an "idiot," I was "stupid," I didn’t get "it," and one person even called me "The Great Satan" for my anti-tech stock views. I was sworn at and another creep (during the height of the mania) took pleasure in leaving made-up songs espousing my worthlessness on my answering machine.
Eventually, I was amply rewarded for my steadfastness as the put options paid off in a big way. Though I would eventually sell off the put options and go long a number of tech stocks in October 2002—at the bottom, I was still concerned with the Fed’s continued interventions.
In July 2002, I started building a significant position in the precious metals, primarily gold and gold miners. Never a gold "bug," I had not owned a single ounce of gold until I made three very small coin purchases each year in 1998-2000. When I began buying precious metals positions in earnest in 2002, gold was selling at $300 an ounce. In my August 2002 letter, I explained (for the first time—you’ve heard it many times since) that I was making a bet on the end of the 20-year bear market for gold, a bet against the US dollar, a bet against undisciplined fiscal spending and budget deficits and "a bet against Greenspan and the Fed, who I fear will flood the system with money as the stock market and economy continues to contract." Twelve years later and the Fed is still flooding the system with money—at what would have been unimaginable levels back in 2002.
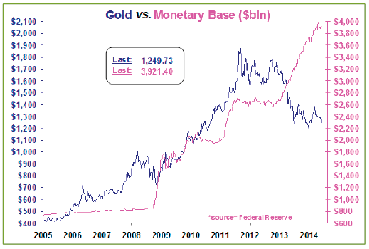
It was a great bet. The 2000s decade was called a "lost decade" for stocks but it was a golden decade for precious metals, as we all know. The Fed’s easy money conditions (historically low interest rates) led to a housing bubble and a credit bubble in the mid-2000s. I successfully bet against both of those bubbles with put options against the likes of Toll Brothers, WCI Communities, Lennar, New Century Financial, Lehman Brothers and Bear Stearns, among others. After 2002, I continued to invest in tech stocks (with the exception of the 2007-2008 period, when I again went short) but the precious metals were my standard bearers throughout the decade. There were healthy corrections after spikes (see chart on page two, sourced from Meridian Macro Research 212-696-5706, meridianmacro.com) in 2006, 2008 and in 2011, but the bull market was never really derailed until recently. Gold rose for 12 consecutive years until early 2013 when a violent, leveraged futures-led sell-off dropped gold to $1200 an ounce by the end of June 2013. We’ve been bouncing around ever since. Once again, the wait for the resumption of the secular bull market (for gold) seems interminable.
The chart on page two, which is sourced from an over 100 page weekly "Gold & Silver" charts report from Meridian Macro (I pour through it at the end of every week), matches up the price of gold and the "US Monetary Base." The monetary base, also known as "high-powered money," which banks have as reserves to use for lending, is controlled by open market operations of the Fed. Lowering the monetary base usually has the effect of tightening the money supply and raising it typically loosens it (depending upon the pace of bank lending—i.e. the "money multiplier"). Money supply growth starts with the Fed raising the monetary base. It is the fount of all inflation. That’s how money is created, though there can be long leads and lags.
When the Fed electronically creates money out of thin air to buy the tens of billions of treasuries and mortgage bonds through its quantitative easing (QE) program each month, it increases the size of the monetary base. So far, the Fed’s ballooning of the monetary base has only led to high (wild?) asset inflation (bonds, stocks, farmland, art prices, etc.) and not to wild consumer price inflation (though last month’s letter discussed the "real" rate of consumer inflation—much higher than the government reports. Eventually, however, big increases in the monetary base will lead to high consumer inflation when the "money multiplier" normalizes, unless the Fed buys back the bonds. That would be contractionary and with the economy so weak (the worst economic recovery in modern US history even after 5 1/2 years of massive money printing, zero percent interest rates and a tripling of stock prices), there’s zero chance of the Fed buying back bonds in the near future.
Right now, the money multiplier keeps falling as inflation psychology remains in Phase One of the three phases of inflation (see discussions of the three phases of inflation according to Austrian economists Rothbard and Mises in past letters). Phase One is when everyone is worried about deflation (though the problem really is economic stagnation) and banks fail to lend and sit on their growing (excess) reserves. At some point we’ll shift into Phase II, as inflation fears come to the fore. The Fed is doing their darndest to keep inflation psychology subdued (thus all the speeches by Fed board members about "deflation" even as everyday living expenses rise). So far the Fed has been able to keep inflation psychology under control, allowing it to create ever higher amounts of electronic money (increasing the monetary base) in its futile attempt to stimulate the economy to an "escape velocity" that never seems to occur. We don’t get to escape velocity because money printing never works, as negative unintended consequences overwhelm any positive wealth effects from the asset inflations created.
The Fed’s easy credit conditions and money printing keeps creating asset price booms (tech bubble, housing bubble, credit bubble) and busts that it then has to respond to with ever greater amounts of stimulus. Today, we have a yield bubble with investors chasing bonds of every stripe (junk bonds, Greek bonds, emerging market bonds, etc.) to historically low (unsustainable) yields. There’s also another stock market bubble that will likely burst as the Fed tries to exit from its QE3/QE4 printing program. Last month Ned Davis Research reported that the Price to Sales ratio of S&P 500 stocks (median) is at an all-time high. I repeat—a record level— higher than at the 1929, 2000 and 2007 tops. Price to Earnings ratios (P/Es) aren’t quite as high thanks to all the corporate financial engineering contortions (stock buybacks, tax rate reductions, write-offs of costs, mergers and roll-up accounting) that help inflate the "E"s, though by the Shiller cyclically-adjusted earnings calculations, P/E ratios are about 50% above the norm.
Thanks to the Fed, it’s currently too dangerous to be long most stocks and too dangerous to be long any but the shortest of duration bonds. So I wait for the Fed’s warped financial world to once again implode. When that happens, there’s a good chance that investors will finally lose faith in the Fed and inflation psychology will shift to the second phase, as the Fed once again rushes to the rescue (with QE5) of an economy suffering from the effects of another busted bubble. By then it may be clear that the central bankers’ money printing cannot create economic growth but does create inflation and ultimately, very nasty choices for the country ahead.
As I look at the chart on page two, it makes perfect sense to me that the price of gold should rise along with the monetary base. And that’s exactly what happened from 2002 to 2013 (this Meridian chart begins in 2005) until someone (and to this day we still don’t know who was behind it) decided to break the price of gold with late-in-the-night futures bombing attacks in mid-April 2013. This wasn’t actual physical gold selling. This was highly-leveraged (rumored to be 30 or 40 to 1) paper derivatives selling (thousands of contracts) at the most illiquid time in the night within the space of a few minutes. No normal seller trying to obtain the best price would ever sell in this fashion. There is no doubt that it was done to manipulate the gold price lower.
The effect of the "attack" was to drop the price of gold down by over $200 an ounce (13.6%) in less than two trading days. It was the equivalent of a huge "flash crash" type of event on the stock market, with the difference being that stock market flash crashes always lead to investigations. Not this time. I speak to some of the most plugged-in "Swiss gnomes" in the gold market and no one can identify with any certainty who was involved in the attack. There are plenty of theories and plenty of gold "haters" with motives (including the neo-Keynesian central bank supporters who are threatened by a rising gold price), but no hard evidence.
As you can see on the Gold vs. Monetary base chart (page two), when the Fed instituted its QE1 bond buying program in late 2008, the Monetary Base soared and the gold price followed. After QE1 unsuccessfully concluded (the stock market sank) QE2 was instituted by the Fed and again, the monetary base soared and the price of gold went along with it. Then came the granddaddy QEs of them all in late-2012/early-2013, the QE3/QE4—$85 billion a month (over $1 trillion per year), no-termination-date monstrosity that sent the Monetary Base into its biggest (and longest) climb yet. Only now is the rate of ascent beginning to moderate with the Fed’s "tapering" (reductions in monthly purchases). Had gold climbed along with the Monetary Base as it had in past years, gold would be well over $2000 an ounce right now, rather than the $1245 an ounce it’s at currently.
This separation has been quite convenient for the Fed and all the other central banks around the globe that have engaged in similar money printing operations (Japanese, British, Europeans, Swiss etc). Gold has traditionally been seen as an inflation barometer and a limiter on central bank money printing and the subsequent monetization of government debts (which continue to soar as well).
Physical Gold Demand Originates From the East
COMEX futures traders in New York do not buy or sell physical gold. They trade paper contracts that in theory could be settled with real gold, but in practice almost never are. The biggest buyers of physical gold are in Asia, primarily China and India. When the New York/London paper traders put gold on sale in April of last year with their price suppression, the physical gold buyers acted as one might expect—they swamped the gold shops, clearing out inventories. You may recall the pictures of the long lines out the doors of the shops and the frenzies inside. That led to huge spikes in gold imports from China and India in April and May to satisfy demand. For decades, India had been the largest consumer of gold in the world, importing as much as 1,000 tons a year. Owning gold is ingrained in their culture. It’s ingrained in Chinese culture too, except the Chinese government had banned private ownership of gold until recent years and now they openly encourage gold purchases.
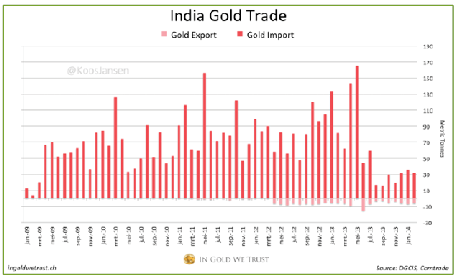
As you can see from the chart on page five covering the last four years, gold imports into India—already at high levels in 2009 through 2012—jumped to record levels (nearly 170 tons in May 2013). A similar spike in demand came from China. Now this might have caused a crimp in the paper gold suppression scheme from the West, except that the Keynesian-trained Indian finance minister (Harvard Business School educated) of the long-ruling, left-leaning Congress Party came to the rescue with a series of ever tighter gold import restrictions – a massive increase in the gold import duty (from 4% to 10%), a rule mandating that 20% of all imported gold be re-exported, and enough new rules and sign-off hurdles to choke off almost all (legal) imports. You can see the result on the right side of the chart (below). Imports plunged from that near-170 ton record in May to just above 10 tons a few months later. Though smuggling rings later raised the totals a bit, physical gold demand from the world’s largest buyer had effectively been cut off. As would be the case with anything, effectively eliminating the world’s largest buyer from the market served to depress the price of gold.
It was just in time, because physical demand from the Chinese and other Asian countries continued to grow and the Chinese alone ended up consuming as much as 2,000 tons of gold last year, and over three-quarters of that was imported. For perspective, global gold mine production in 2013 was a little less than 2800 tons. So where did all this extra gold imported to China come from? We know from the big Swiss refiners (the biggest in the world) that a tremendous amount of gold flowed out of the Western-based gold ETFs (gold in the ETFs dropped by 880 tons—much of it stored in London vaults), two-thirds of which came out of the big GLD ETF based in the US (equaling the prior four years of inflows). Most of it flowed to the Swiss refiners who processed it by melting down the London Good Delivery sized bars, and then increasing the purity and decreasing the size to kilo bars to meet Chinese requirements. The gold then flowed East. The Swiss are now publicly reporting these flows on a monthly basis. The top buyers for the Swiss refiners in April 2014 were India, Hong Kong, China and Singapore; accounting for nearly 70% of Swiss exports. The top suppliers were the UK and US.
The one-time dump of gold out of the Western-based ETFs from demoralized gold owners and redemptions from large funds dramatically reduced the amount of gold in the ETFs. From the beginning of 2013, gold in the GLD ETF has fallen by 42%. Two of the biggest owners of the GLD ETF, Paulson & Co. and Goldman Sachs, both cut their positions by more than half over the past nine months. Nearly 400 tons also came out of COMEX inventories last year. The paper gold traders have to keep a certain amount of gold on hand in order to meet shipment requests for physical gold. Those inventories were stripped last year, potentially to dangerously low levels.
Dramatic Changes Ahead in 2014 Gold Market
A sizeable rally in gold and the miners at the beginning of the year has mostly evaporated (though gold is still up 3½%* on the year—better than most US stocks). Nevertheless, the grinding nature of the cyclical bear market has unsettled gold owners further. As is the case at bottoms, seemingly every article written by the media about gold has had a negative slant (it’s exactly the opposite at tops). Many gold bulls are having a difficult time understanding why gold is down when there’s so much money printing going on around the world (and reconciling the glaring gap on the chart above).
Major stock indices keep hitting new highs, though stocks are only up slightly year-to-date, and many investors are paying little attention to the warning signs of change ahead—the horribly low trading volumes, sinking small stocks and worsening bad breadth. Even the collapse of the crazily-priced tech and internet stocks in March and April hasn’t shaken the faith. The VIX "fear gauge" is under 12, a level of complacency not seen since the Spring of 2007—just a few months before the stock market crash that began later that year. The economy is awful, but the weakness is attributed to "bad weather," even though retail sales were poor in April, too, and housing market activity has been sinking for months. Business capital spending remains in the doldrums. The biggest elephant in the room that the stock bulls can’t seem to see is the Fed’s tapering. As we’ve written before, the past two attempts to end the Fed’s QE programs (QE1 & QE2) did not go well (steep market declines). We’re due for another $10 billion cut in two weeks and another at the end of July. By that point, the Fed’s QE program will likely be down to just $25 billion per month—a long way from the $85 billion printed throughout last year.
*As of July 11th, it is now up 11%.
The gold market typically does well when stocks are weak and not so well when they’re strong. But there are other major changes specific to the gold market happening this year that I believe position gold for an imminent big up move. Though gold bears and the media have tried to claim that Chinese gold demand is "waning," in fact it has remained at very high levels, though not as high as the beginning of the year leading up to the Chinese New Year seasonal buying. Chinese imports have also not recently been as high as they were a year ago. But that comparison is not fair, as demand in China (and India at the time) was off-the-charts after the gold price plunge in April 2013 triggered a buying frenzy. The World Gold Council expects gold demand from China to be flat this year compared to last year’s record level and then to rise again by another 25% by 2017. Although net imports into China from Hong Kong dropped 13% from a year ago in April to 65.4 tons, the most recent weekly data out of the Shanghai Gold Exchange indicates another surge in Chinese gold consumption.
Though gold demand from China is expected to be similar to last year, demand from India is likely to be significantly higher, especially in the second half of this year as the Indian Finance Ministry’s gold buying restrictions are lifted. New Prime Minister Modi swept into office in an unprecedented landslide victory for his BJP Party over the interventionist Congress Party. Modi, strongly pro-business, had criticized the prior administration’s gold buying restrictions. Jewelry production is one of India’s biggest businesses (second largest export business) employing over 1.3 million people directly or indirectly, and was severely harmed by the gold import restrictions. Modi’s recently named finance minister (Arun Jaitley) had his first meetings last week and reportedly at the top of the agenda was a discussion over the lifting of the prior administration’s gold import restrictions. Bachhraj Bamalwa, director with the All India Gems & Jewelry Trade Association, recently said that he expects the 10% import tax to be cut and rules to be reduced on importers in July.
Recently, the Reserve Bank of India sharply increased the number of trading houses allowed to import gold and enabled banks to make gold loans to domestic jewelry makers, a practice that was halted last year. A week ago Asia Age estimated that just these two measures taken by the Reserve Bank "would help improve the supply of gold from 25-30 tonnes per month to 55 tonnes per month," (a "nearly double" in gold imports).
Gold prices in India have recently plunged as traders anticipate a normalization in import supplies. Premiums, as high as $160 an ounce over the global gold price (in December) have dropped by $120 an ounce to just $40 in recent days. The Wall Street Journal ran a deceptively headlined story a week ago titled: "Gold’s Shine Dims in India." The title highlighted the short-term plunge in prices in India and only got to the heart of the matter later in the story: "Ultimately, the lifting of import restrictions should lead to stronger demand in India, which would support prices globally, analysts said." I saw a better titled story in a much less read industry journal: "India’s Futile ‘War on Gold’ Ends—Demand to Rise."
Refer back to the "India Gold Trade" chart (page five). Indian gold imports have been artificially suppressed for the better part of a year. In the second half of this year, there’s going to be pent-up demand for gold from India, on top of the still strong demand from China and other big gold buying countries such as Russia, Turkey and the Middle East. In April, Russia bought 28 tons of gold (worth $1.4 billion), its second highest monthly purchase on record. Russian president Putin recently declared: "For us (Russia and China), it is important to deposit those (gold and currency reserves) in a rational and secure way. And we together need to think of how to do that keeping in mind the uneasy situation in the global economy." Russia and China last month also signed a gargantuan $400 billion natural gas deal in which the two countries will use their own currencies in bilateral trade (rather than the US dollar). Geopolitical tensions are rising—also favorable for gold.
With the world’s leading gold consumer, India, getting back near full import strength, physical gold demand will be high, but not all the supplies sourced from last year will be available. Supplies from the UK and US to Swiss refiners have recently been running 40% lower, as the ETF selling from last year has almost completely dried up. Last year a lot of hot-money gold owners gave up during the big initial decline. As gold then bounced around within a range, the process of time ground down even more owners, causing them to sell. Now we’re at the point where I hear a lot of whining, but those gold owners who are left (strong hands) refuse to give up, as they know in their hearts they shouldn’t. Demoralized, they reach out for support, but they do not sell. The result is an incredible shrinkage of trading volumes for gold, silver and the miners. We’re at a point where there’s little selling or buying. Such moments typically signal change. It feels to me that any small amount of increased buying would trigger an explosive upward move.
Even among gold bulls, the consensus is that any such rally can’t happen until later as gold is seasonally weak in June and often bottoms later in the summer. That’s because it’s usually a soft period for buying in India (before the harvest, holiday and wedding seasons). However, due to the unusual circumstances explained above, that could be very different this year.
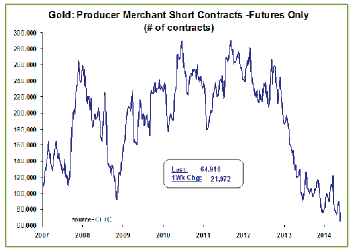
Last weekend as I flipped through the Meridian Macro 100 page Gold and Silver report (Meridian also provides charts for just about every economic series – not just precious metals), I was struck by just how bullish so many of the charts looked. Here are just a couple of examples. The gold producer/merchant short futures contracts chart (see below) shows that their short positions plunged last week to a new low—30% lower than the deep drop-off at the exact bottom in late-2008 (when I made a killing after loading up on depressed gold miners) and also lower than at the June and December 2013 bottoms when sharp rallies followed. The producers and merchants—who know the industry well and are usually right—build up their short positions in front of tops, as can be seen near the 2011 and 2012 gold tops, and reduce short positions near bottoms.
Another chart (not shown here due to space limitations) shows "Managed Money" futures positions. Managed Money (speculators) are almost always spectacularly wrong at tops and bottoms. They were heavily long at the 2011 and 2012 tops, and last week their short positions skyrocketed by 44% on another COMEX bombing run (thousands of contracts dumped all at once) in order to break the $1280 gold price technical level. Speculators dumped over 100 tons of "paper gold" onto the market, almost all of it by selling short. While they succeeded in breaking the level short-term, there was little follow through and no stampede out of ETFs—as occurred last year. This gold bombing run triggered an opposite reaction—8.4 tons ADDED to the GLD ETF on the day of the attack (and another two tons today). The Managed Money speculators are now vulnerable to a short squeeze.
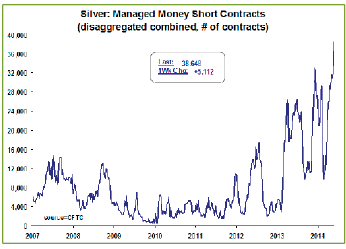
The silver Managed Money short contracts chart (below) is even more extreme, with the dumb money’s short positions off the charts. Note that every spike in short positions on this chart (August 2007, October 2008, July 2012, June 2013 and December 2013) soon led to 89%,120%, 33%, 33% and 16% rallies respectively. Also note that at silver’s big top in 2011, Managed Money owned almost no short contracts. They were massively net long nearly 220,000 contracts at the top—and they were destroyed.
I wake up every day now wondering if "today" might be the day when gold and silver begins to explode higher (filling that gap on the page two chart) and stocks and (maybe bonds too) turn lower. That’s what my 35 years of investing experience is telling me. Everything seems to be in place. I even have gold haters taunting me. One crank is sending me regular email missives about how awful an investor I am and negative media stories and cartoons bashing gold. Seems like old times—just like 1999/early-2000. Note to the crank (not a subscriber): You’re not discouraging me—if anything, it’s the opposite. No one can make me believe in central bank planning. No one can make me believe that money printing works. I have thousands of years of history backing this up. These dangerous dweebs at the central banks have created a disaster-in-waiting.
Important Disclosures
This report is for informational purposes only and does not constitute a solicitation or an offer to buy or sell any securities mentioned herein. This material has been prepared or is distributed solely for informational purposes only and is not a solicitation or an offer to buy any security or instrument or to participate in any trading strategy. All of the recommendations and assumptions included in this presentation are based upon current market conditions as of the date of this presentation and are subject to change. Past performance is no guarantee of future results. All investments involve risk including the loss of principal. All material presented is compiled from sources believed to be reliable, but accuracy cannot be guaranteed. Information contained in this report has been obtained from sources believed to be reliable, Evergreen Capital Management LLC makes no representation as to its accuracy or completeness, except with respect to the Disclosure Section of the report. Any opinions expressed herein reflect our judgment as of the date of the materials and are subject to change without notice. The securities discussed in this report may not be suitable for all investors and are not intended as recommendations of particular securities, financial instruments or strategies to particular clients. Investors must make their own investment decisions based on their financial situations and investment objectives.