“We were assured by policy makers that QE provided large benefits to the real economy. If so, won’t its reversal in the form of QT come with a cost? It can’t be all rainbows and unicorns.” -Stan Druckenmiller and Kevin Warsh (the latter a former senior Fed official, referring to the Fed’s first round of QT back in 2018. The same warning applies today.)
It’s no April Fool’s gag that the first quarter was a rare down one for stock investors. That is, unless they were closely following this newsletter’s repeated recommendations to have considerable hard-asset exposure.
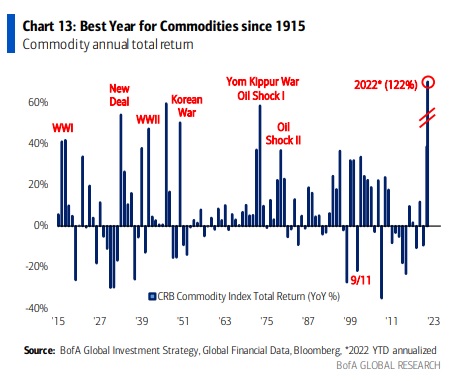
The S&P 500 total “un-return” was minus 4 ½% in Q1, while the NASDAQ, most investors’ favorite playground, retreated 9%. Moreover, as I’ve often written, the damage to the typical stock was far worse than what the averages reflected. This was despite a spirited rally in the second half of March, though it did fade right at quarter’s end. On the other hand, commodities — i.e., real assets — had their best quarter since 1990. According to BofA’s Michael Harnett, their annualized return thus far this year is the best since 1915.
Normally, stock market downside leads to bond market upside. Yet, like so many things these days, normal isn’t the prevailing state of conditions. In fact, bonds suffered their worst quarterly performance since the summer of 1980, when Jimmy Carter was still in the White House. The main fixed-income benchmark lost 6%, one of those very rare instances where bonds fall more than stocks.
This result syncs with a point I’ve long made in these pages, and also in my new book, Bubble 3.0: the probability that bonds no longer offer the risk reduction aspect they have since 1981. It’s also been my contention that this decade is likely to be similar to the 1970s, when bonds and stocks were positively correlated. This is unlike the teeter-totter behavior seen pretty much right after Mr. Carter exited the Oval Office. As old-timers like me recall, the Disco Decade was brutal for both stocks and bonds. They moved down together, particularly net of inflation, meaning they were positively correlated.
When I was writing my book in the second half of last year, I couldn’t have known, of course, that my fears of a renewed downside linkage between equities and debt instruments would be realized as soon as the first quarter of 2022. To be totally accurate, there were numerous episodes over the last 40 years when stocks and bonds went up together. There were also a few when they tumbled simultaneously. But during times of severe market stress, like the crash in October 1987, bonds did provide powerful portfolio protection. The punishing bear market of 2008 to early 2009 also saw long-duration U.S. treasuries rise in price as stocks were being thrashed.
The problem with bonds right now is most definitely the risk that I’ve been highlighting since the late summer of 2020: inflation. The Wall Street consensus has been in denial about the upside inflation breakout and, frankly, it mostly still is. The prevailing belief remains that the CPI will, before long, revert to a 2% to 3% range. Otherwise, long-term bond yields would be much higher than 2.7%, where they are today. This represents a doubling of the 10-year T-Note from where it was fewer than six months ago. What’s fascinating about bonds presently is the shape of the yield curve. No doubt, you’ve been reading and hearing about the inversion that’s already happened between certain treasury bond maturities. (Short tutorial: the yield curve is simply the pattern of yields and maturities ranging from three months all the way out to 30 years. Generally, the slope of the curve is positive, meaning shorter maturities yield less than longer ones. However, at times – usually when the Fed has been raising rates for a year or more — shorter rates become higher than longer rates. One of the best predictors of a recession is when the yield curve inverts. Inexplicably, the Fed has consistently ignored this signal over the last century, further impairing its shockingly poor economic forecasting reputation.)
Because the Fed is so far behind another curve, the one involving inflation, it is being forced into a highly aggressive monetary stance. This is most unlike the Jay Powell Fed which has almost always erred on the stimulative side, often ludicrously so (see last year). Based on the reality that inflation is running north of 7%, and the Fed’s key overnight rate is still closer to zero than 1%, it is now in a quandary about which it was repeatedly warned in 2021. Experts as luminous as Larry Summers — the former Obama Administration treasury secretary — repeatedly cautioned Powell & Co it was making a grave error by letting the inflation horse out of the barn… and many miles down the road.
Gently tapping the brakes is not an option, it now needs to slam them. Further, as it fabricated $120 billion/month for most of last year — and continued to create fake money even into this year — it now needs to oversee only the second “double tightening” in history. This means both raising rates and selling down its faux-money-acquired bond portfolio. Ironically, Mr. Powell tried this back in 2018, but at a leisurely pace. Yet, even then, the Fed was forced to reverse course, having raised the fed fund rate to a lowly 2 3/8%, due to a combined stock and bond market rout. (Fair warning: prepare for a repeat performance.) But let’s get back to the always fascinating message produced when shorter rates rise above longer yields. What’s strange about today’s yield curve is that the inversion has happened despite the Fed remaining in an exceptionally easy mode. This is notwithstanding its recent ¼ of a percentage point rate nudge. Back in 2018, the Fed had been slowly hiking for over a year, which eventually inverted the curve. Also odd is that the shortest end of the yield curve, from three months to 18 months, is extremely steep. Specifically, a three-month T-bill yields around 0.7% whereas an 18-month T-note returns 2.4% (treasuries longer than a year are considered notes; those beyond 10 years are referred to as bonds).
This leads me to the key point of this missive – there is a no-brainer opportunity to move out of cash into 12-to-18-month treasuries. For those sitting with substantial sums in bank accounts or money funds, this is an easy way to pick up around 2%. That’s admittedly well below inflation, but it’s far better than zero-yield cash. It’s my expectation, based on history, that banks and brokerage firms will move like molasses in January during a Polar Vortex when it comes to raising the interest rates they pay on short-term deposits. Should rates continue to rise over the next year-plus, you’ll be able to roll over your treasuries at higher yields. If you can hold them for six months, you should also be able to sell them in case you need the money, or the market plunges, for a minimal loss, if any. This is known as riding the yield curve, which is beneficial to do when it is as steep as the short-term T-note market is presently. So, ride away, right away!