
“Lesson: In the real world, ninety-nine cents will not get you into New York City. You will need the full dollar.”
– Bruce Springsteen, Born to Run (back when people wanted to get into NYC, rather than out of it)
“The desire of gold is not for gold. It is for the means of freedom and benefit.”
– Ralph Waldo Emerson
Prior to the Great War, the gold standard* reigned supreme. However, when World War I broke out, most countries abandoned this standard to pay their military expenses with printed money, which devalued their currency. The United States, which was a rising world power at the time, remained off the battlefield for the first two years of the war and became an important supplier to the United Kingdom, France, and other Allied Powers. As a result, the United States became the lender of choice for those that bought US supplies in return for foreign bonds – and gold. When the Great War began in 1914, the British pound was the world’s leading reserve currency. However, five short years later, and the US dollar replaced the pound as the world’s leading reserve currency.
In the decades that followed, the United States once more supplied the Allies with weapons and other goods for World War II. The United States was again paid largely in gold, propelling it to hold the vast majority of the world’s most precious metal in its coffers. This precluded a return to the gold standard by almost all of the countries that had depleted their gold reserves. In 1944, the Bretton Woods Agreement was formulated. Pursuant to this, the Allies, who would go on to win the war the next year, determined that the world’s currencies could no longer be linked to gold, but could be linked to the US dollar, which was, in turn, linked to gold.
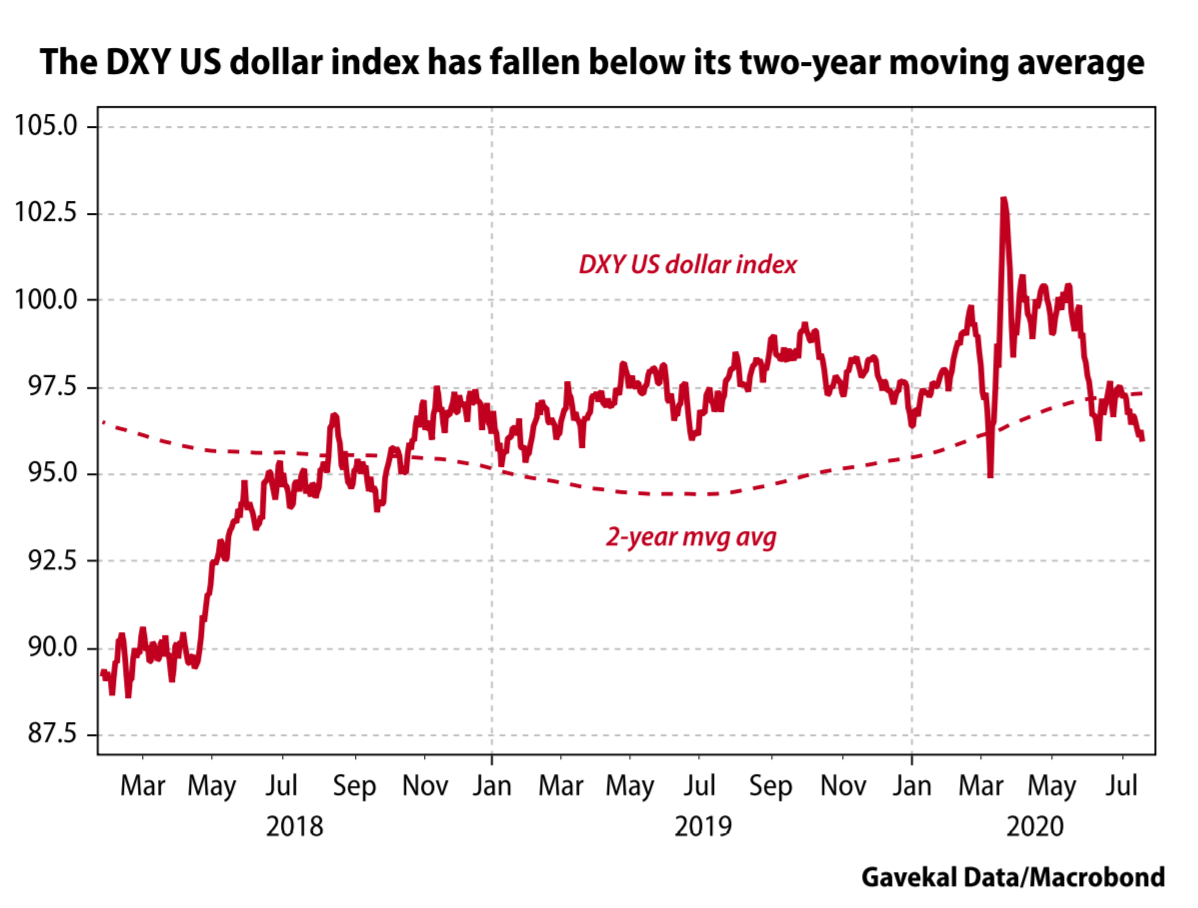
Fast forward to today, and more than 61% of all foreign bank reserves are denominated in U.S. dollars – either in the form of cold hard cash or U.S. treasuries. This reserve status is largely based on the strength and size of the US economy and financial markets. However, as the U.S. Treasury has continued to print U.S. dollars to stabilize the economy and markets in response to the havoc unleashed by the Covid-19 pandemic, the once-mighty U.S. dollar has come under some serious pressure.
In this week’s final installment of Louis-Vincent Gave’s three-part series on possible explanations for the recent rebound in global equity markets, Louis considers the possibility that investors are flocking into equities out of fear that the U.S. dollar could be worth a lot less in the years ahead. As you will read, two of the main beneficiaries of this tidal shift have been gold, which recently hit an all-time high, and gold miners, who have outperformed all other asset classes year-to-date.
The jury is still out on whether the dollar’s long run as the world’s leading reserve currency will be sustained in the coming years. However, as discussed in our May 1 newsletter, our bet is that the US dollar will be the major casualty in an era of unbridled monetary and fiscal stimulus.
On the flipside, those who have traded in their greenbacks for gold bars (and other precious metals) are likely to see a red-hot bull run continue to rage on, notwithstanding inevitable corrections along the way. Speaking of “way”, this bullion bull market might just go way, way above the $2,000/ounce level it has nearly attained. If it seems incomprehensible that gold might rise as high as $3,000/ounce (as some respected analysts have suggested), is it any more incredible that the Fed’s trove of treasuries, bought with its seemingly limitless bogus bucks, will soon hit $10 trillion? Never say never…especially these days.
* The gold standard is a monetary system where a country's currency or paper money has a value directly linked to gold.
Disclosure: Louis Gave has an equity ownership in Evergreen. Louis’ views and opinions are his own, and are not necessarily the views of Evergreen. Securities highlighted or discussed in this communication are not a recommendation for or against these securities. Evergreen actively manages client portfolios and securities discussed in this communication may or may not be held in such portfolios at any given time. Please see important disclosures following this piece.
In the second quarter of this year, global equity markets registered their best quarterly performance in two decades. What was behind this record-breaking rebound? A number of explanations appeared possible. In the first paper of this series, I considered the possibility that markets were pricing in a return to the macro environment that prevailed in the post-2008, pre-Covid-19 world. In the second paper, I pondered the possibility that investors had simply lost their senses. In this, the third paper, I will consider the possibility that the present growth in monetary aggregates is leading investors to conclude that they have no alternative; money is being debased at such a pace that sitting on cash in a bank account is, over the long term, sheer madness.
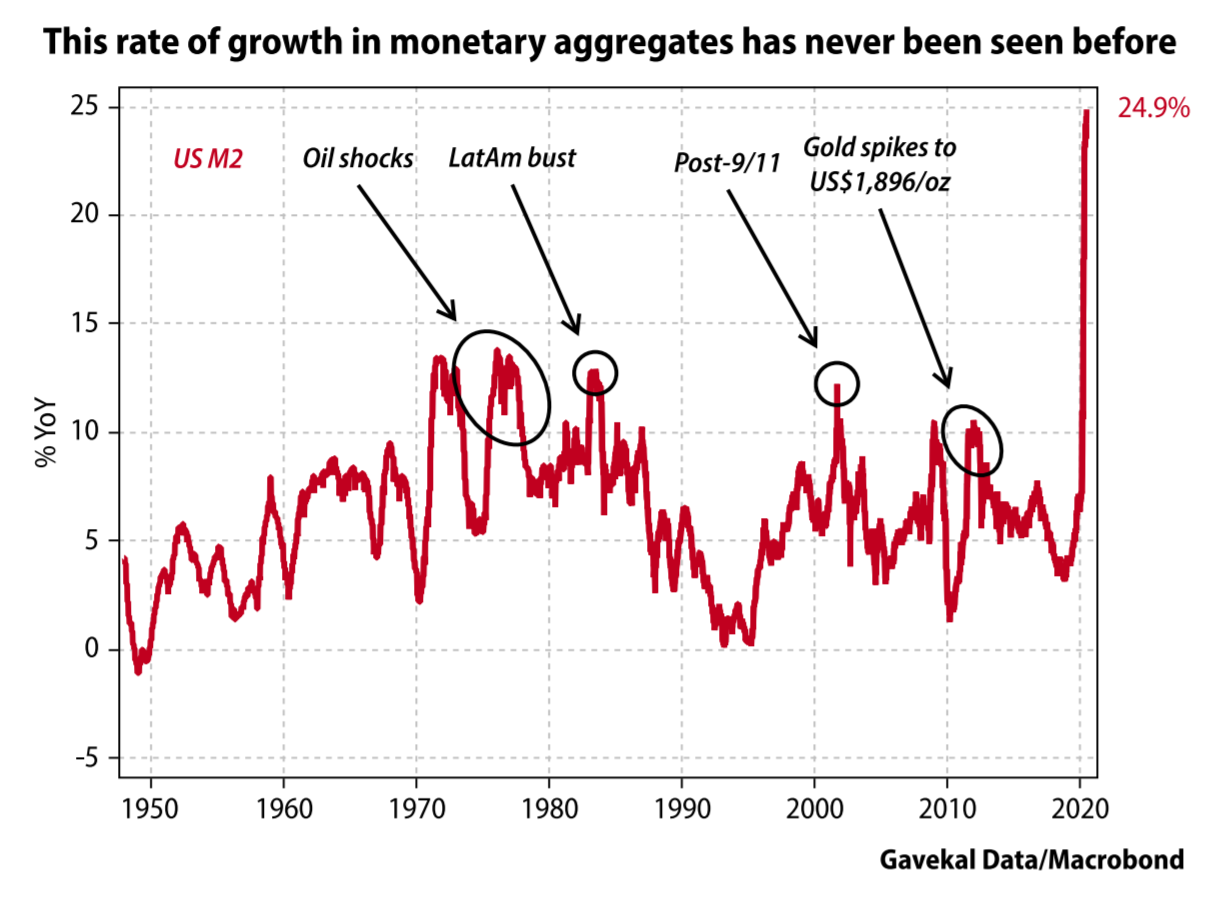
Over the last few months US monetary growth has broken new highs week-after-week. Today US M2 growth stands at 24.9% year-on-year, more than six times the structural growth rate of nominal GDP. So the idea that cash is in danger of becoming worthless is no delusion; this rate of money printing has never been seen before in the history of the US, or of any other G7 economy.
An uncomfortable diagnosis
Finance 101 teaches that the price of an equity is determined by a company’s future cash flows, discounted by an interest rate, to which is added a risk premium. Theoretically then, to be successful an investor should only have to formulate a view on these three variables. But is it really that simple? Consider the following:
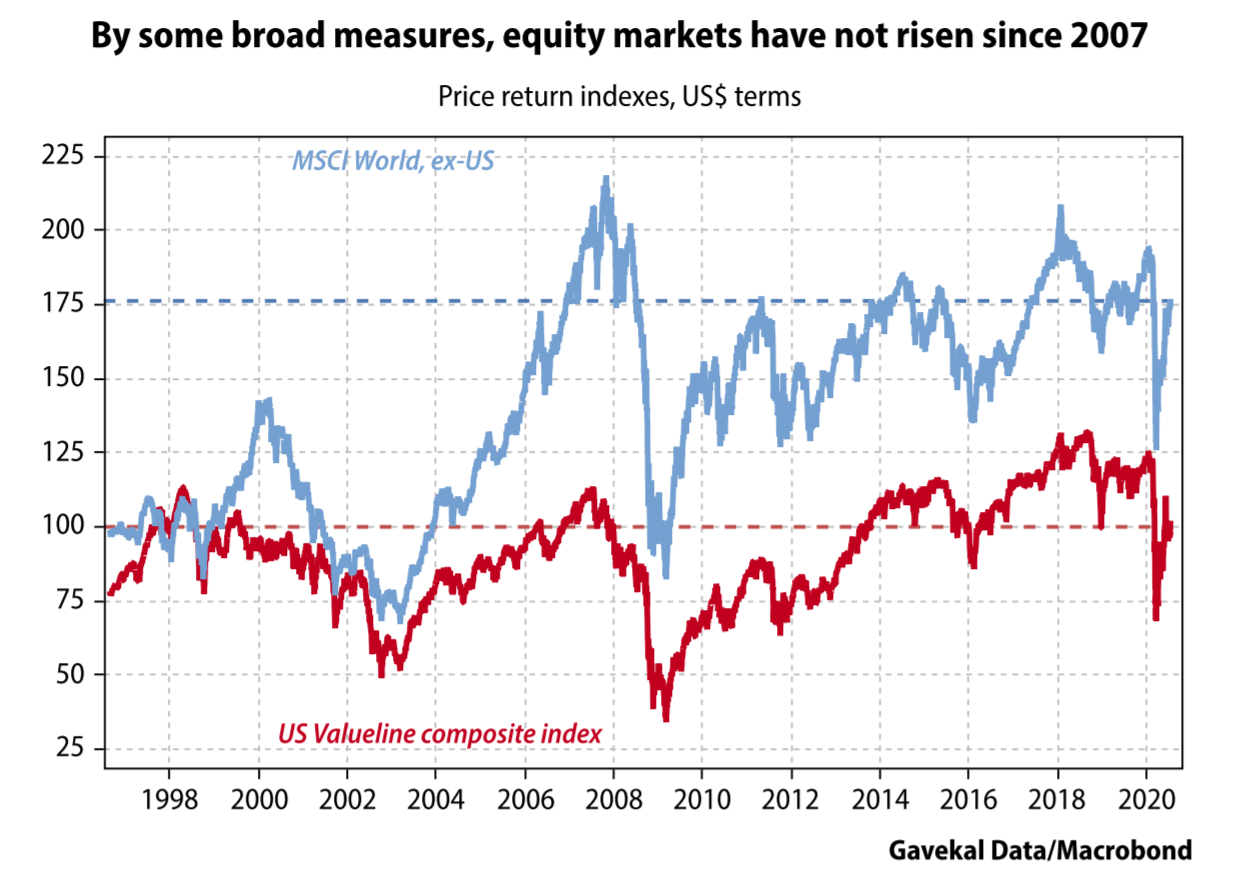
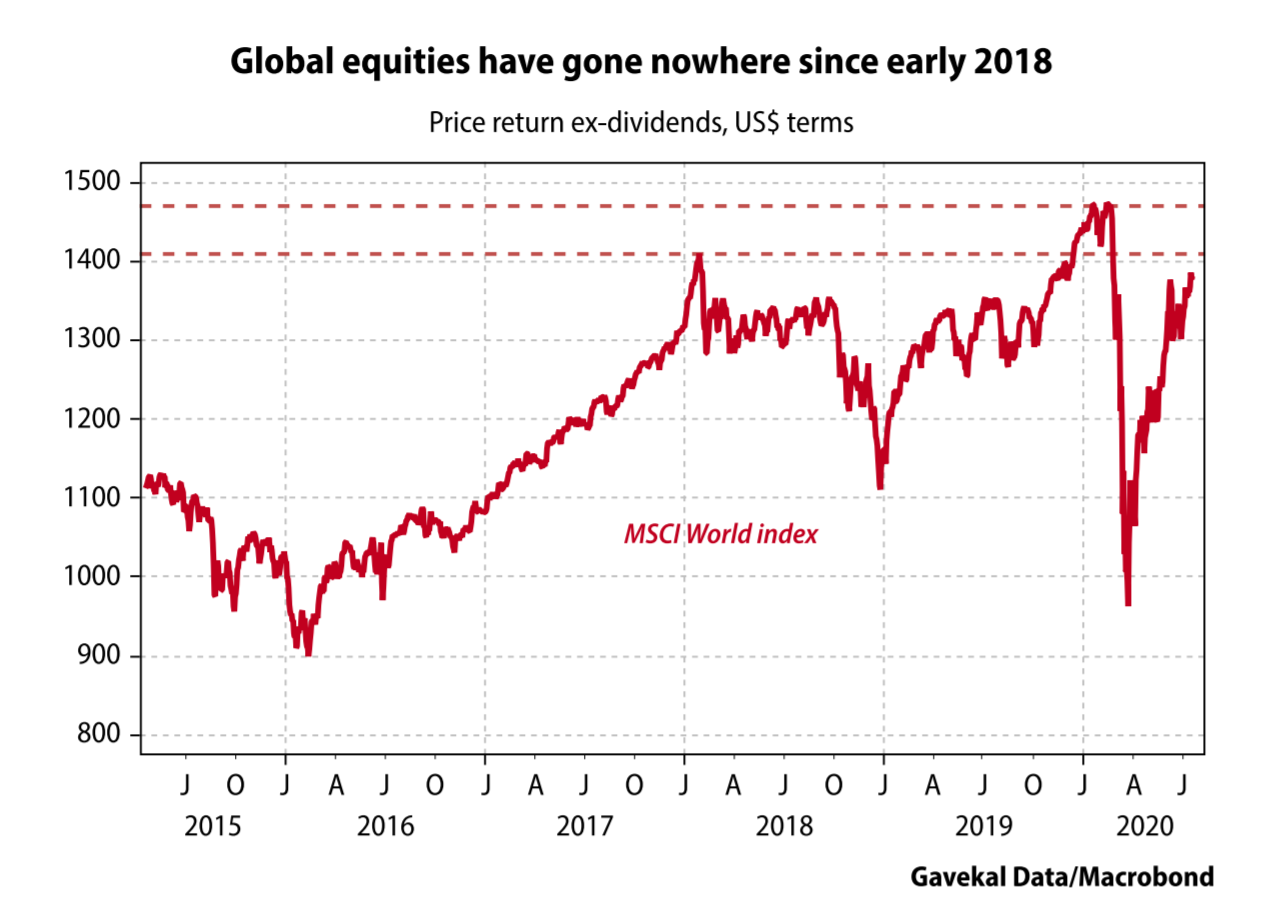
Or maybe the simpler explanation is that for all the talk about the rampaging equity bull market, global equities aren’t in much of a bull market at all. In the first two papers of this series, I pointed out that the MSCI World ex-US index has flatlined since both 2007 and 2014. Perhaps even more surprising, the Valueline composite index, which is arguably the best proxy for the performance of the median US stock, stands at the same level today as in 1998 (see the chart below).
Admittedly, the Valueline is a price index, and so does not include the contribution of dividends to total returns. Nevertheless, the failure of key broad equity market benchmarks to make anything like new highs despite all the talk of a rampaging equity bull market is remarkable. So where should investors actually look to find this remarkable bull?
Finding the rampaging bull
Defining a bear market is easy enough: if the price of an asset falls by a given amount—for equity indexes, usually -20%—then it is generally accepted that the asset is in a bear market. But if it is to be useful, the definition of a bull market needs to be more complicated. The financial media usually talk about a 20% rise as a “bull market,” but that hardly seems satisfactory. Under that definition, oil, which has more than doubled from its mid-April lows, would be in a bull market. However, very few energy investors have been popping the champagne corks lately.
So, it may be more useful to propose an alternative definition: an asset class is in a bull market when its underlying price continues to make new cycle highs.
This handy definition is particularly useful today, given that markets bottomed in mid-March 2020, and have since rallied hard almost everywhere around the world. Yet within this broad rebound, some assets have gone on to make new highs for the year, while others have not. With this in mind, it is easier to argue that the assets that have made new highs are in a bull market, while those that have yet to recover their start-of-the-year levels still have a lot to prove.
Using this—admittedly self-serving—definition narrows the current bull market down greatly, and so this investigation is within manageable limits. Sticking to the “must have made new year-to-date highs” benchmark, it becomes clear that:
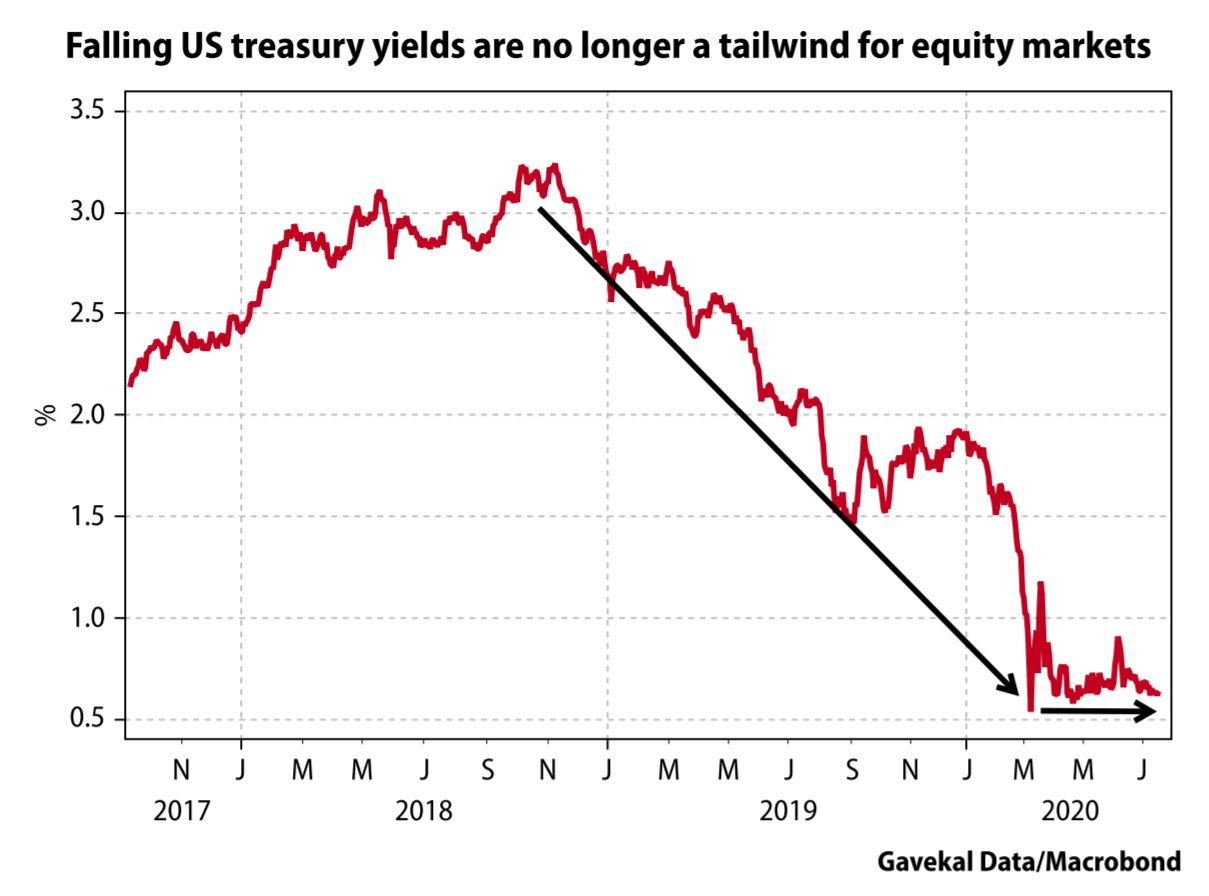
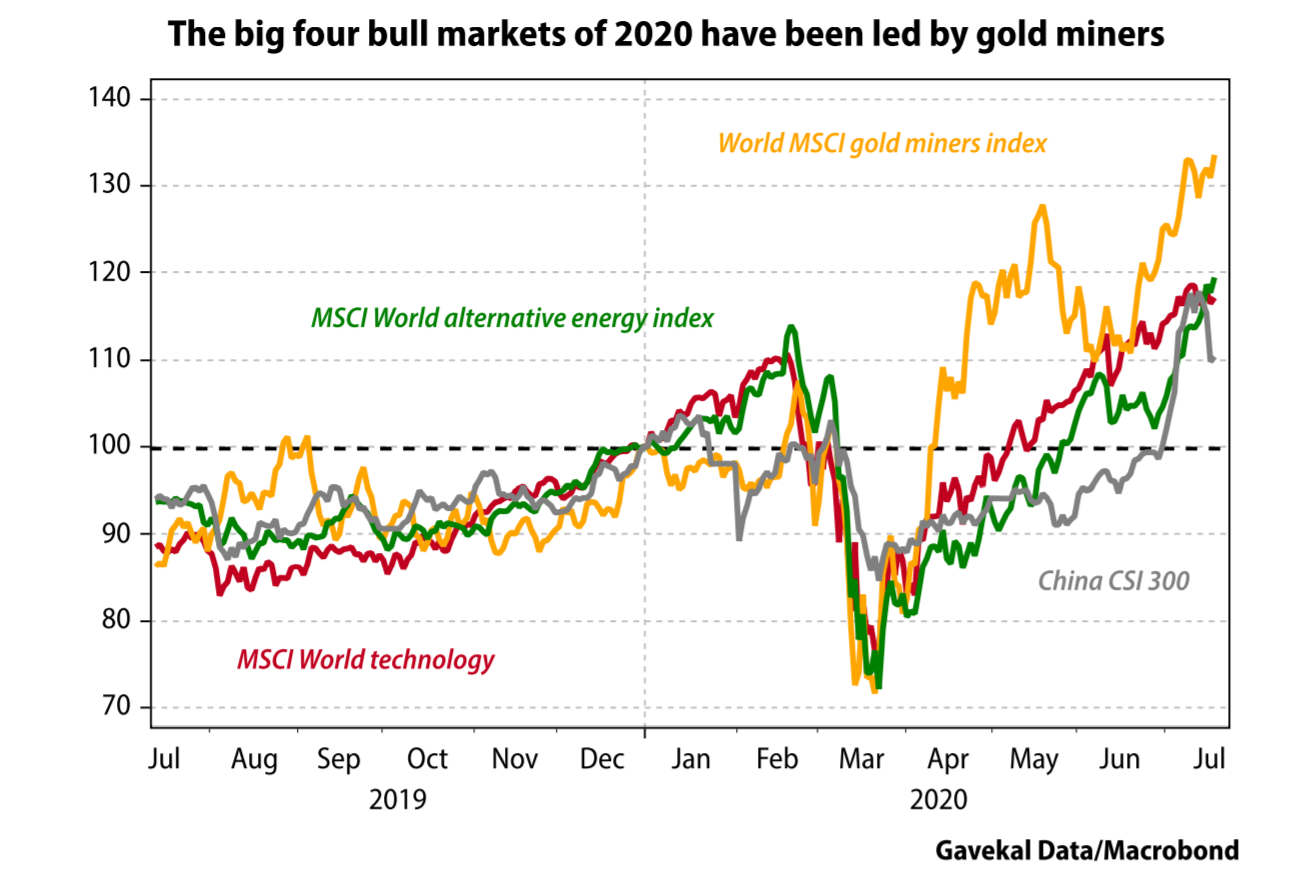
Nonetheless, behind this backdrop of flat interest rates, mild US dollar weakness and flatlining—albeit volatile—global equity markets, the rampaging bull has found a home in four different asset classes: (i) Big Tech, (ii) green investments, (iii) precious metals, and (iv) Chinese equities. And of these, precious metal miners have outperformed all other asset classes year-to-date. Let’s look at these four bull markets one-by-one.
The Big Tech bull market
Many liters of ink have been spilled over the Big Tech bull market. The subject is unavoidable, if only because Facebook, Amazon, Apple, Microsoft and Google now account for more than a fifth of the S&P 500. As a result, the decision either to overweight or to underweight Big Tech has made or broken many portfolio managers’ performance in recent years. And it’s likely to continue to do so for a good few years to come.
In Have Equities Become A Bubble?, I reviewed the most cogent argument against overweighting Big Tech—that the law of large numbers presents a serious hurdle to future gains. To illustrate this challenge, let me propose the following exercise. Let’s accept that:
If we accept these two points, then, as the chart below illustrates, for the maths to “square up,” we would have to imagine the following:
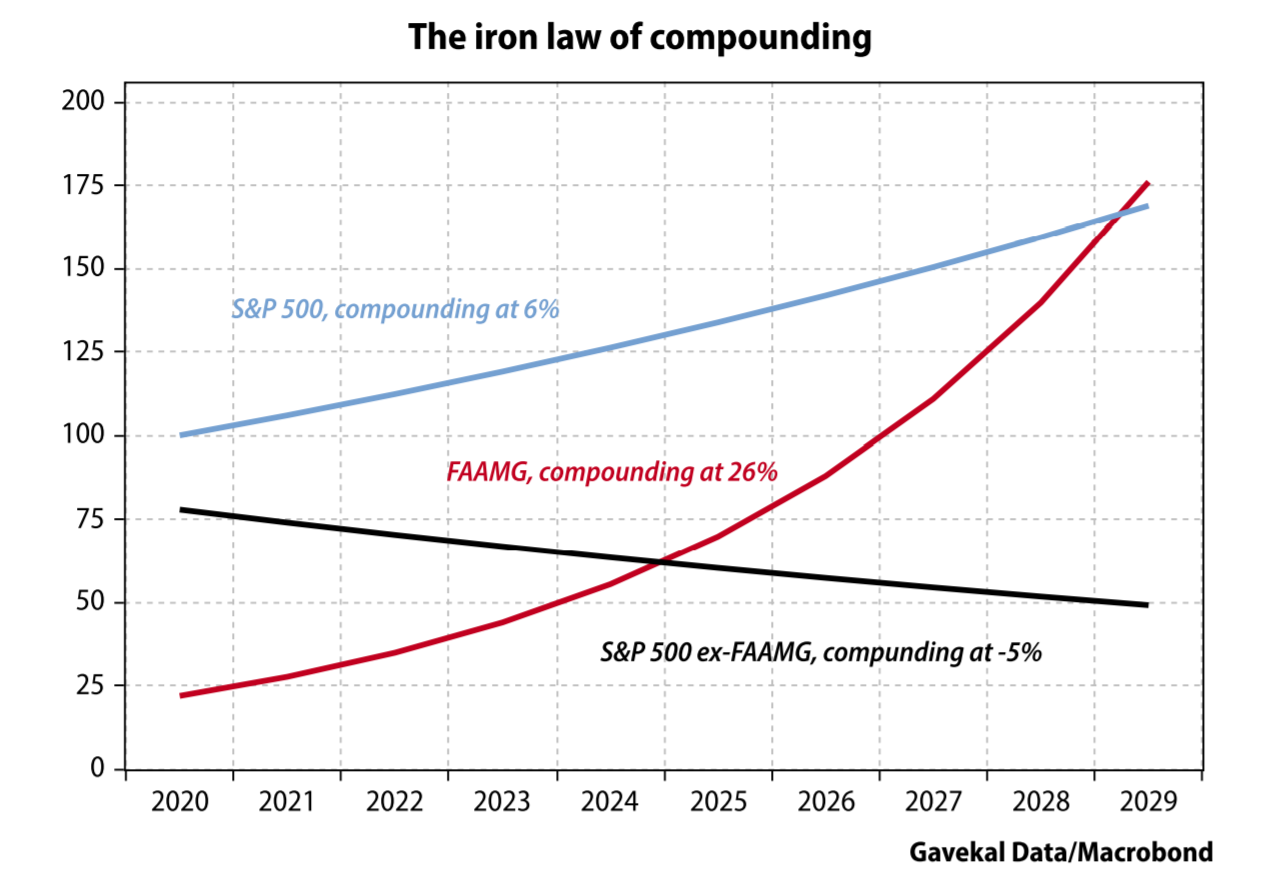
As readers will have realized, there is an obvious flaw in the chart above: if the FAAMG do continue compounding at 26% over the coming decade, then as they begin to make up an ever greater share of the S&P 500, the S&P 500 as a whole would begin to compound at a faster rate. And this begs the question whether the S&P 500 can compound at a rate much higher 6%.
The first pillar on which the Big Tech bull market rests is that inflation and economic growth around the world will remain modest for as far as the eye can see. And in a world with low inflation, low growth and low interest rates, investors might as well pay up for aggressive growth stocks. In a low return world, the 15% annual profit growth delivered by Big Tech stands out so blatantly it warrants a 26% share price appreciation.
This brings me back to the challenge of big numbers and the iron law of compounding (Albert Einstein reputedly said that there is no more powerful force in the universe than compounding). This iron law faces an obvious logical challenge.
Trying to square this particular circle, investors can come to only one of two possible logical conclusions. The first is that FAAMG stocks will not be able to keep compounding at 26% a year. At some point in the future, we will look back at Microsoft on 11.5 times sales, Tesla on 10.5 times sales, and Facebook on 9.5 times sales and remember the words of Scott McNealy, the CEO of Sun Microsystems, who said of the early-2000 valuation of his company:
“At 10 times revenues, to give you a 10-year payback, I have to pay you 100% of revenues for 10 straight years in dividends... That assumes I have zero cost of goods sold, which is very hard for a computer company. That assumes zero expenses, which is really hard with 39,000 employees. That assumes I pay no taxes, which is very hard. And that assumes you pay no taxes on your dividends, which is kind of illegal. And that assumes with zero R&D for the next 10 years, I can maintain the current revenue run rate... Do you realize how ridiculous those basic assumptions are? You don’t need any transparency. You don’t need any footnotes. What were you thinking?
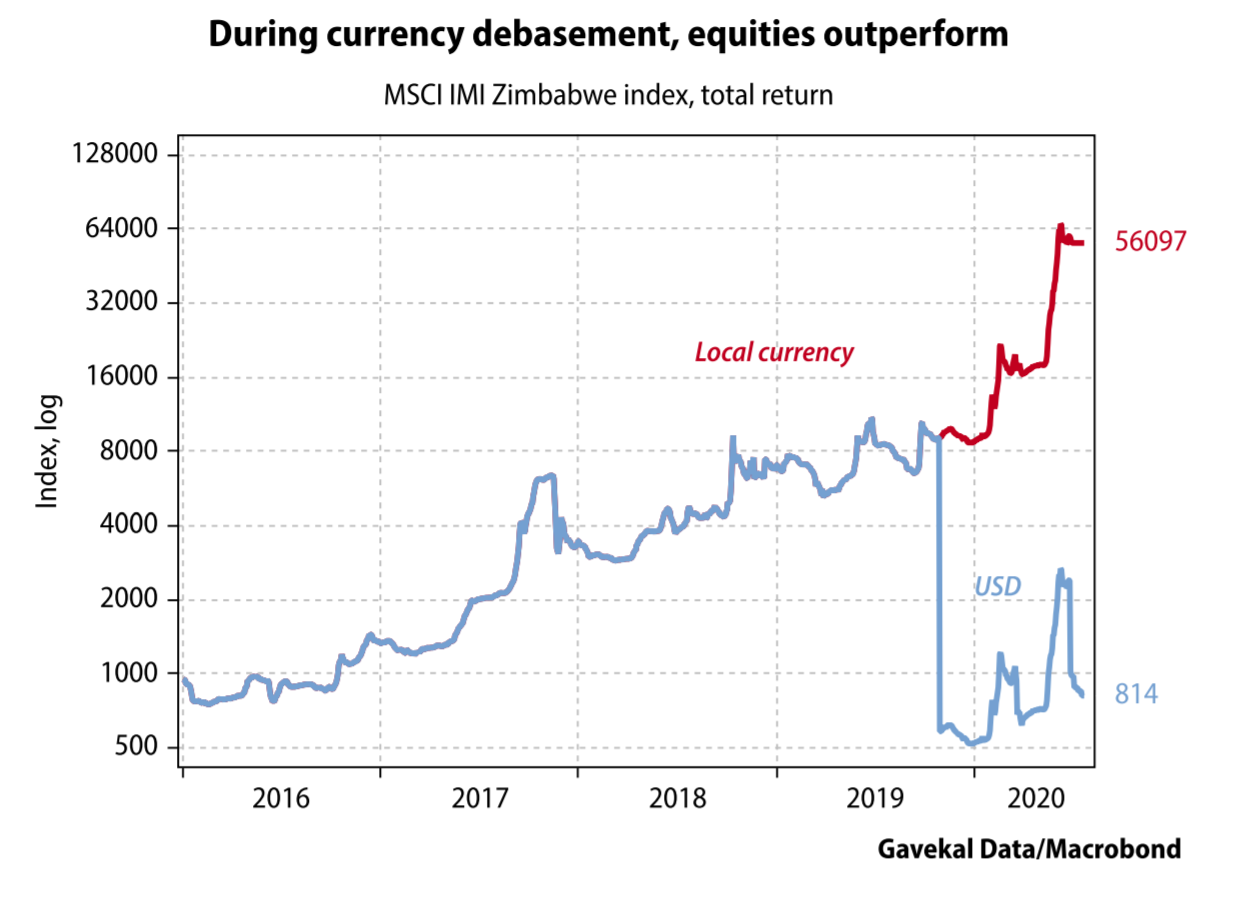
The second possible conclusion to square the circle of FAAMG stocks compounding at such a high rate that the broader market also compounds at an ever higher rate, against a backdrop of weak US and global GDP growth, is that the currency in which all of this is denominated becomes ever more worthless. And in an environment of rapid currency debasement, equities usually outperform bonds and cash, even in the absence of credible GDP growth. One particular example springs to mind.
This brings me to the second bull market that is unfolding: the one we might call “the rise of the green machine”.
The rise of the green machine
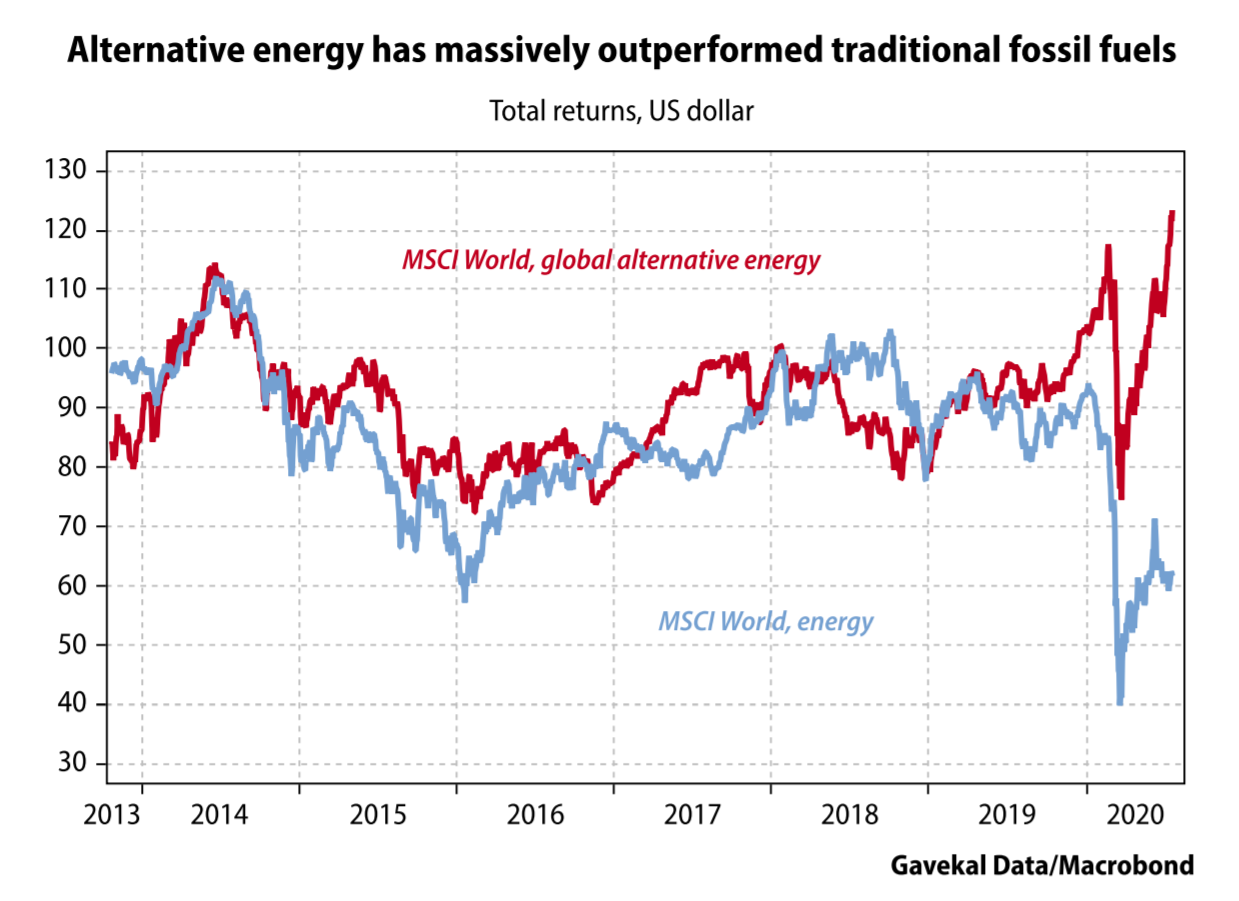
In the chart below, the red line tracks the performance of alternative energy stocks around the world. The blue line tracks the performance of more traditional energy providers—mostly oil producers, some natural gas, and a tiny little bit of coal. For most of the past six years, these two energy provider segments delivered roughly the same performance.
This makes sense given that, by and large, alternative energy companies and traditional energy companies sell—at bottom—the same product: energy. The one key difference is the way this energy is produced.
Suddenly, however, the difference in the method of production has become important enough to justify a massive divergence in performance between the share prices of the two groups of energy producers.
This divergence leaves investors facing a question: why should the value of alternative energy producers be climbing to new highs, even as traditional energy producers continue to be the biggest three-legged donkey in the paddock? There are three possible explanations.
Richard Cantillon, an Irishman who spent much of his life in France, only wrote one book: Essai Sur La Nature Du Commerce En Général. It was only published after his death in the early 18th century and today is seldom studied in economics classes, even though it was a ground-breaking text in the history of political economy, and one which had a huge influence on the likes of Knut Wicksell, the economists of the Austrian school, and the great Irving Fisher.
Cantillon’s starting point was, originally for the times, the value of money. While everyone uses money to measure all the other values in the system, few economists before Cantillon had spent any time trying to understand why money has value in the first place, or just as importantly, why that value changes over time. The reason Cantillon was drawn to the subject may have been because he lived in such extraordinary times.
One of Cantillon’s contemporaries was John Law, who through his Mississippi Company ignited an epic boom and devastating bust in France, which until then had been by far the wealthiest country in Europe. It is fair to say that despite the long list of Englishmen who through history have inflicted such damage on France—Edward the Black Prince, Horatio Nelson, the Duke of Wellington, Brian Moore—none have caused as much damage as the Scotsman Law. However, at least one positive thing came out of the bust: Cantillon’s insights. And these were derived from practical experience; Cantillon was a phenomenally successful speculator, who made out like a bandit in both the South Sea and Mississippi bubbles, first on the way up, then on the way down.
Cantillon’s key insight was that when “new’” money is created, those who are closest to the source of its creation are the first to see the prices of whatever they are selling rise. By contrast, those furthest from the source of the money will be the last to see the prices of their particular wares increase. To cut a long story short, if we define inflation as an increase in the money supply, then its main impact is a change in relative prices—and not, as most people believe, a change in absolute prices.
Those who are close to the central bank get rich; those who are not get poor. As a result, investment piles into the “favored” sectors, while the rest of the economy is starved of money. Eventually, these changes lead to a misallocation of capital with the appearance of multiple false “natural rates,” while there is only one market rate. It is in this mechanism that we find the origin of the market crashes which, as night follows day, always come after major misallocations of capital.
As an example, Cantillon cited the 16th and 17th centuries’ massive increase in Latin America’s production of silver, most of which was “captured” by the King of Spain. As a result, the prices of the goods bought by the Spanish court skyrocketed immediately, while food prices took a long time to follow. And when the production of silver eventually collapsed, all the “court-linked sectors” went bankrupt.
Fast forward to today, and is it possible to imagine a sector closer to power than alternative energy? Which of today’s professional politicians does not want to be seen to be writing checks for the clean energies of the future, produced right here at home? And at the same time, is it possible to think of an industry further from the center of power today than big oil?
When former vice president Joe Biden announces a plan to spend US$2trn once he’s elected on a “green new deal,” is the motivation behind his largesse the promise of future financial returns? Or is it the desire to signal virtue? (With other people’s money, naturally; the US is already running multitrillion US dollar budget deficits, with a debt-to-GDP ratio now higher than at its World War II peak. But who’s counting?)
I would argue the latter. This implies that the performance of the alternative energy bull market is an especially strong signal of a Cantillon effect unfolding right in front of our eyes. And on the other side of a Cantillon-effect bull market always lies currency depreciation.
This brings me to the third of today’s bull markets: precious metals.
The bull market in precious metals
Year-to-date, gold and silver miners have outperformed all other major asset classes. This outperformance has come against a backdrop of steadily rising gold prices, and sharp rallies in silver prices. Gold has now made new all-time record highs in every currency except the US dollar. And when it comes to the US dollar, if you look at quarterly averages for the price of gold, then the average price in 2Q20 of US$1,780/oz was a shade above the average price of US$1,772 at the peak of the previous bull market in 3Q12.

If anything would confirm that the current bull market is driven primarily by currency debasement, it would be the outperformance of gold and silver against all other assets. As it turns out, the metals themselves are not outperforming tech. But gold and silver miners are. The question is whether this outperformance carries an important message about today’s world.
Historically, once gold bull markets get going, they tend to be long, drawn-out affairs, interrupted only by sharp tightening from the US Federal Reserve, as in 1981, or by a sustained rise in the US dollar, as in 2012. Today, neither appears to be on the cards. So, what will stop the bull market in gold?
One answer might have been a major bust in the emerging markets. Most of the physical demand for gold today comes from India, China, South East Asia and the Middle East. The Indian sub-continent weighs especially heavily in the supply and demand equation. When things go well in India, the marginal rupee tends to find its way into gold. And when things go badly, it has generally flowed out of gold. This pattern makes the current bull market all the more remarkable: gold prices have been rising even though the Indian economy has ground to a standstill.
However, even as India has hit the skids, the world’s second gold market, China, has been thriving. Or at least its stock market has been ripping higher.
The China bull market
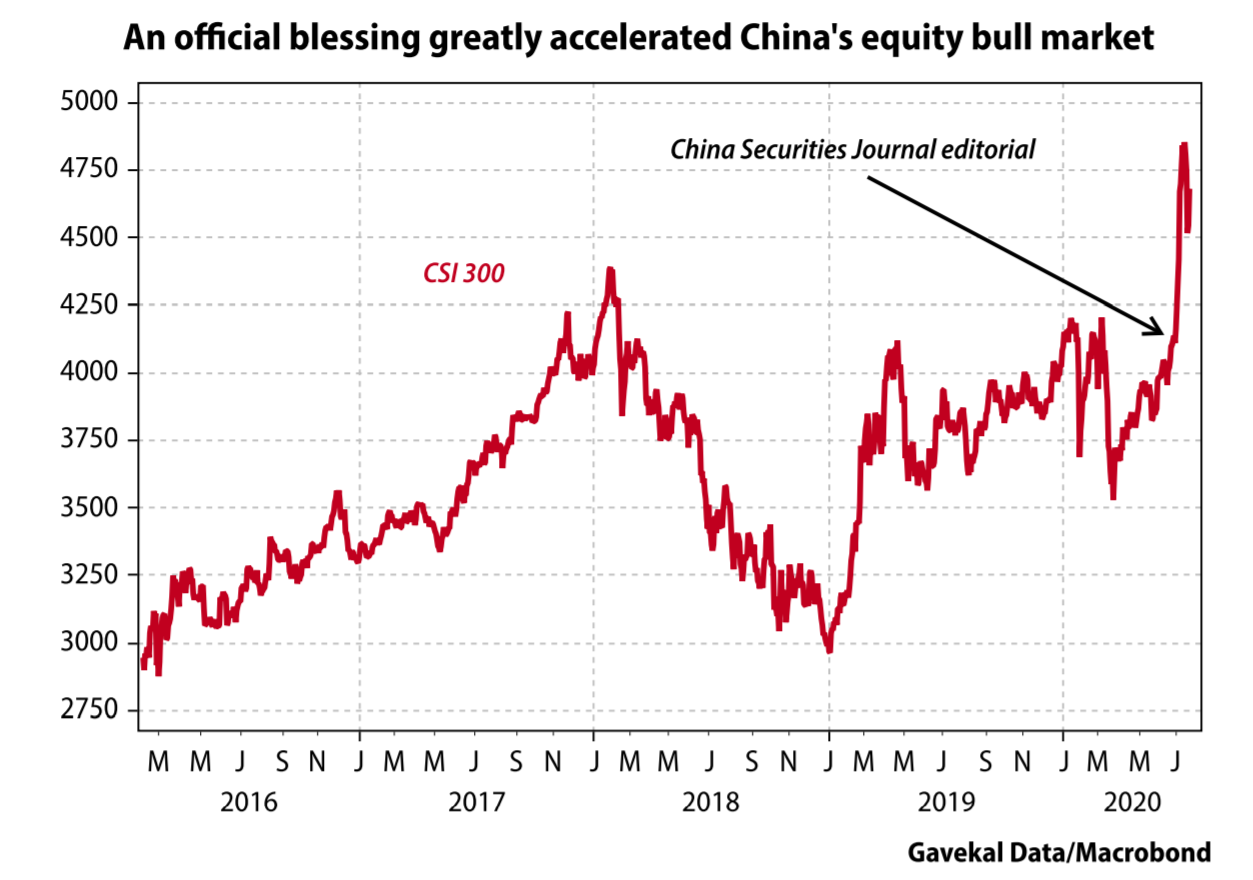
With Covid-19 originating in China, the US-China relationship deteriorating further, China imposing a highly unpopular security law on Hong Kong, global trade collapsing, the UK banning Huawei, China and India coming to blows in the Himalayas, and the Chinese government doing far less fiscal and monetary stimulus than any other major government, who would have thought that the CSI 300 would be outperforming all other major markets year-to-date, except for the Nasdaq? Yet, that is exactly what is happening. And just as success has many fathers, there are probably several germinal forces behind the rising Chinese equity market.
The most obvious hand is that of the government. The market had been grinding slowly higher, like other markets, until an editorial on the front page of the China Securities Journal highlighted that a bull market would be most welcome at the current juncture. The army of Chinese retail investors did not need to be told twice, and the domestic Chinese equity market promptly gapped higher.
But why, following the 2015 debacle, would the Chinese government decide to take another swig from this particular chalice? Possible explanations include:
This last explanation brings me back to the thesis developed in the book that Charles and I wrote a little over a year ago: that China is now actively attempting to dedollarize pan-emerging-markets trade. This matters enormously, because should China succeed, emerging markets across Asia, Africa, Central Asia and Eastern Europe will find themselves needing far fewer US dollars. A world in which the US dollar’s share of global trade starts to shrink rapidly— still highly hypothetical—is a world which would rapidly find itself with far too many US dollars floating abroad.
A world with an overflow of US dollars would be a very different world from the one we inhabit. It would be a world in which:
Now, come to think of it, isn’t this precisely what we are seeing today?
DISCLOSURE: This material has been prepared or is distributed solely for informational purposes only and is not a solicitation or an offer to buy any security or instrument or to participate in any trading strategy. Any opinions, recommendations, and assumptions included in this presentation are based upon current market conditions, reflect our judgment as of the date of this presentation, and are subject to change. Past performance is no guarantee of future results. All investments involve risk including the loss of principal. All material presented is compiled from sources believed to be reliable, but accuracy cannot be guaranteed and Evergreen makes no representation as to its accuracy or completeness. Securities highlighted or discussed in this communication are mentioned for illustrative purposes only and are not a recommendation for these securities. Evergreen actively manages client portfolios and securities discussed in this communication may or may not be held in such portfolios at any given time.