
“Crises take a much longer time coming than you think and then they happen much faster than you would have thought.”
-RUDI DORNBUSCH, economist
“The US stock market capitalization now stands at approximately 130% of GDP, the highest since 1999/2000...I would also note that margin debt is now at record high levels.”
-ROBERT KAPLAN, Dallas Fed President
The Real Zombie Apocalypse? One of the many oddities of our current American culture is its fascination with zombies. The number of TV shows, movies and computer games devoted to these mythical creatures is nearly endless.
Yet, for years around the world—especially in Japan and Europe—zombies have made real appearances. No, not in the gruesomely wounded versions typically portrayed by Hollywood but, rather, in a much more destructive corporate manifestation.
Years and years of zero and even negative interest rates have created a situation where those entities popularly known in the world of finance as zombie companies are able to tenuously hang onto life. It’s remarkable that so many years beyond the financial crisis, the percentage of zombie companies continues to rise.

Their monster (sorry) debts and marginal profitability—the latter often before taxes and interest costs—would typically shuttle them off to bankruptcy and usually to a well-deserved extinction. This corporate version of Charles Darwin’s survivalistic laws allows for more efficient and better financed competitors to flourish and grow.
However, when the zombies are able to hang on for years and years, inhibiting profitability across many sectors, the result is economic retardation—which is exactly what we’ve seen for the past decade. This is notwithstanding the recent “synchronized global recovery”. If you think this appraisal is too harsh, consider that over the past decade there have been three global contractions, including the Great Recession. Although the US has avoided the double- and triple-dip downturns seen by much of the planet at large, it did experience a six-quarter-long “profits recession” (not that this kept the stock market from increasing!).
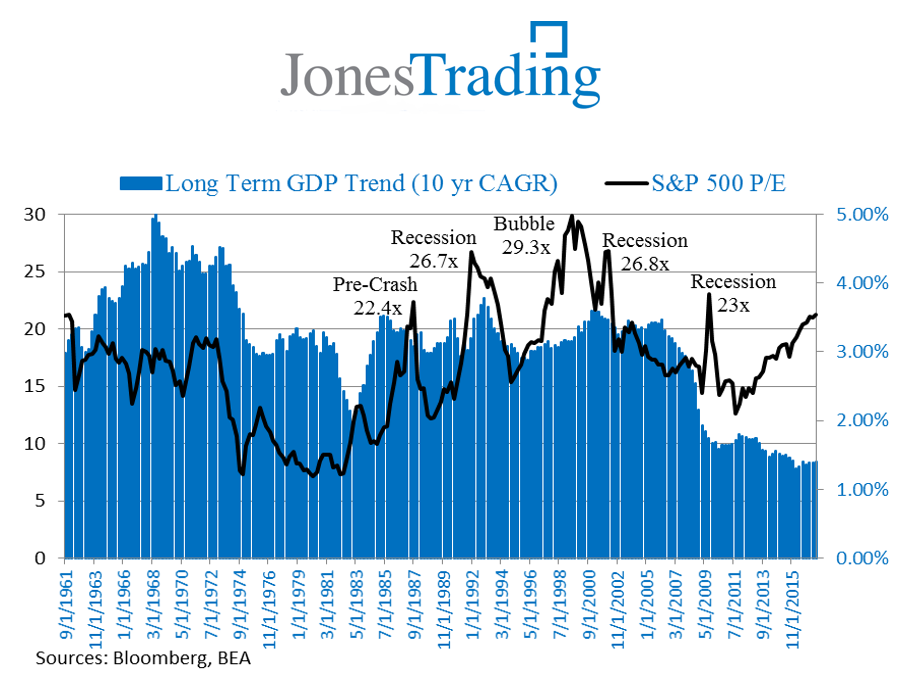
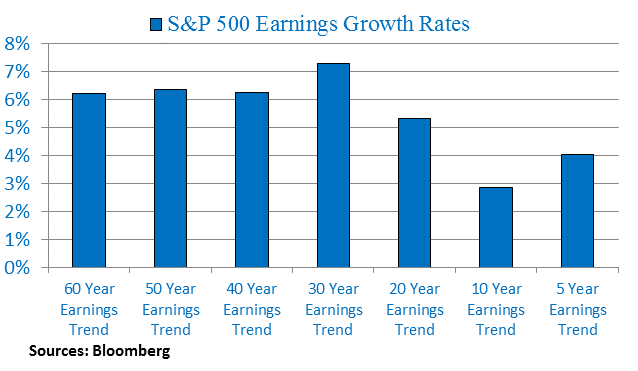
Moreover, even in America GDP increases have dramatically lagged the long-term trendline—despite unprecedented debt and “fake money” creation. In the case of Corporate America—seen as the ultimate profits machine—earnings have grown at just 4% per year over the past five years, a period that doesn’t include an actual recession. This is only about three-quarters of the historic profits trends and those way-back timeframes contain numerous recessions. (The following charts are courtesy of Jones Trading’s Chief Strategist Mike O’Rourke; I had the pleasure of sitting down with Mike in our offices this week and I came away profoundly impressed with his rational and non-consensus views.)
Unquestionably, there have been other growth-inhibiting factors besides zombie companies. The esteemed Dr. Lacy Hunt, who has had one of the past decade’s best economic forecasting records, would argue the root cause was—and is—excessive debt levels. But, in that regard, there is a connection with the zombie phenomenon. Instead of these companies failing and their IOUs being wiped away—with their lenders paying the price for ill-advised credit extension—they hang on, barely able to cover their interest costs. Of course, along the way they make life miserable for their better-heeled peers, cutting prices just to bring in enough revenue to keep them alive.
This problem has been particularly acute with the banking systems in Japan and Europe. Zombie banks are a broadly-acknowledged economic liability because their vast holdings of dud loans renders them unable to finance new and/or economically viable entities. By contrast, the US did a much better job of cleaning up its problem loans after the financial crisis. This is a legitimate reason why the S&P 500 has so dramatically out-performed almost all overseas stock markets over the past seven years.
Even in the US, though, zombie companies exist to a far greater degree than they have in the past. What’s more is that there is a most unusual zombie, at least when it comes to profitability, putting enormous pressure on US corporate earnings.
Amazombie? Pretty much whenever the Evergreen Research Team analyzes a potential new addition to our clients’ stock or bond portfolios, one of the first questions we ask is: “How much is the company at-risk of being “Amazoned”? (Sorry for the nominalization—converting a noun to a verb—but have you “Googled’ anything lately?)
The answer to that question is often “very” and it is applying to a growing number of enterprises and industries. In fact, it’s getting increasingly hard to find companies and sectors that are not directly or indirectly exposed to the wild jungle animal that had its genesis in our once tame city of Seattle.
But we are far from alone in realizing the Amazon threat to individual companies and many industries. The point that I’m making in this EVA is to take this reasoning to the next level. As Amazon, with its essentially non-profit mentality (at least for now), encroaches onto the home turf of more and more companies, what does that mean for Corporate America’s profit margins and, hence, profitability?
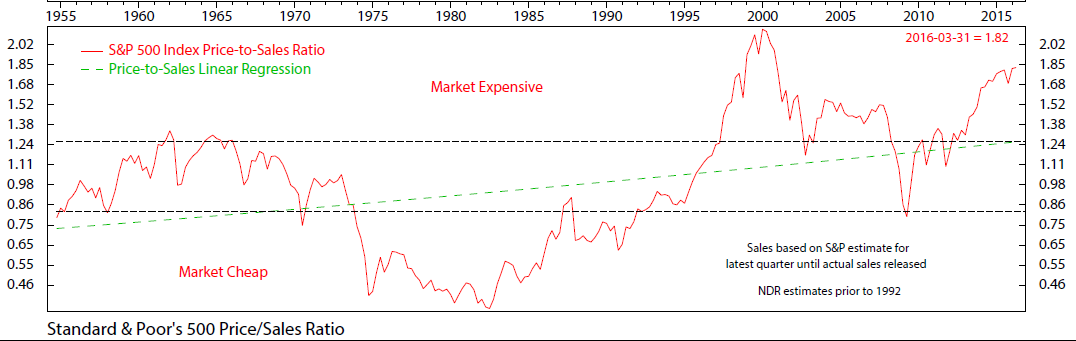
Among the most alarming charts on the US stock market’s present extreme overvaluation is one that we have run multiple times in the past, though not for a while. It is the price-to-sales ratio for the S&P 500 and, as you can, see it is basically back to the apex seen during the biggest equity bubble in our nation’s history.
Yet even more startling is the median price-to-sales ratio which, as you can see, has gone vertical to an extent never before seen.
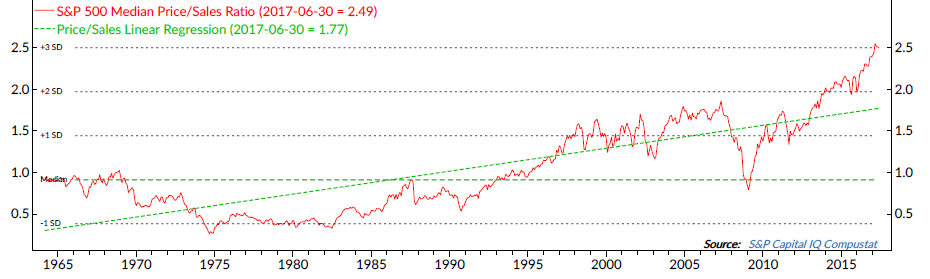
The difference is that the latter is simply measuring the mid-point (the 250th company) in the S&P 500 versus the former which is capitalization-weighted. You don’t have to get into the nitty-gritty of the math but the main message here is that smaller companies remain far more expensive than blue chips, as these pages have so often noted (and it’s not as though most US blue chips are cheap these days!).
And the reason this should matter to long-term-oriented investors (Hello? Are you out there?) is that the price-to-sales ratio has almost a 90% linkage, or correlation, between high readings and low stock market returns over the next ten years (the inverse is true, as well). If you go out even further, the connection goes to essentially 100%. In other words, if you invest when the price-to-sales ratio is extremely high your long-range returns are going to be low—perhaps shockingly so. In the short run, though, even over a few years, this metric is virtually meaningless.
However, let me give you the counter-argument to this: Prior price-to-sales ratios are no longer valid due to the much greater profitability of US companies today. The main rationale cited for this is typically the increasing role played by knowledge-based companies and/or those with a “network effect” competitive moat. Companies like Apple, Google, Microsoft and Facebook are prime examples. They possess quasi-monopolies and, accordingly, are able to realize exceptionally high profit margins.
Amazon, on the other hand, has some of the most enviable competitive attributes but chooses to largely ignore profits in order to realize its presumed ambition of destroying margins for nearly every company in its path. And that path is getting wider and wider with each passing day.*
So far, Corporate America’s profit margins remain close to their highest level ever and have stayed elevated for an extraordinarily long time. This is likely due to the fact that, until lately, labor costs have been very subdued. Further, suppressed wages are widely acknowledged to be the main reason why profitability has not been as cyclical as in the past. (Lower tax- and interest-rates have played a supporting role.) In other words, unusually lofty profit margins are not primarily a function of the increasing impact of asset-light, knowledge-heavy companies such as those mentioned above. This may be due to the negative effect these behemoths have on the rest of Corporate America (see the US retail industry as an extreme case in point).
Lately, there is mounting evidence that wages are rising at an accelerating clip. This is good news for the US household sector which desperately needs relief after many years of static wage increase (net of inflation) and the relentlessly rising cost of “essentials” such as housing and health care. The proof of this squeeze is that the consumer savings rate has recently tumbled to 3%, nearly tied with its lowest reading ever (back during the “House as ATM” era).
Consequently, between the encroachment of Amazon into a growing number of industries and a long-delayed, much deserved, pay boost for US workers, profit margins might do something they used to do every few years but haven’t for a very long time: as in, revert to the mean—and that’s considerably lower than they are today.
* Amazon’s legions of admirers would counter that once it has generally enfeebled--or totally crushed--its competition, it will then raise prices and realize immense profits (which raises interesting anti-trust issues). But at this point this $500 billion market cap company is generating just $2 billion in official earnings.
It’s “On the Other Hand” Time. At the risk of sounding like one of Harry Truman’s economic advisers when he famously cried, “would someone please find me a one-armed economist?!?”, there is a timely reason why profitability might stay high next year, despite the forgoing. The reason for that, of course, is tax reform.
However, to take the equivocation to the next level, there appears to be a decent chance the proposed “massive” corporate tax cut won’t kick in until 2019. If so, that might leave a lot of investors, who are betting on this as a bullish factor for next year, kicking and screaming.
Also, per the comment above about falling tax rates having been a long-term uplifting factor for Corporate America’s after-tax bottom-line, please consider the following chart. As you can see, the IRS’s take of pre-tax profits has been in an irregular but persistent downtrend for the last 65 years.
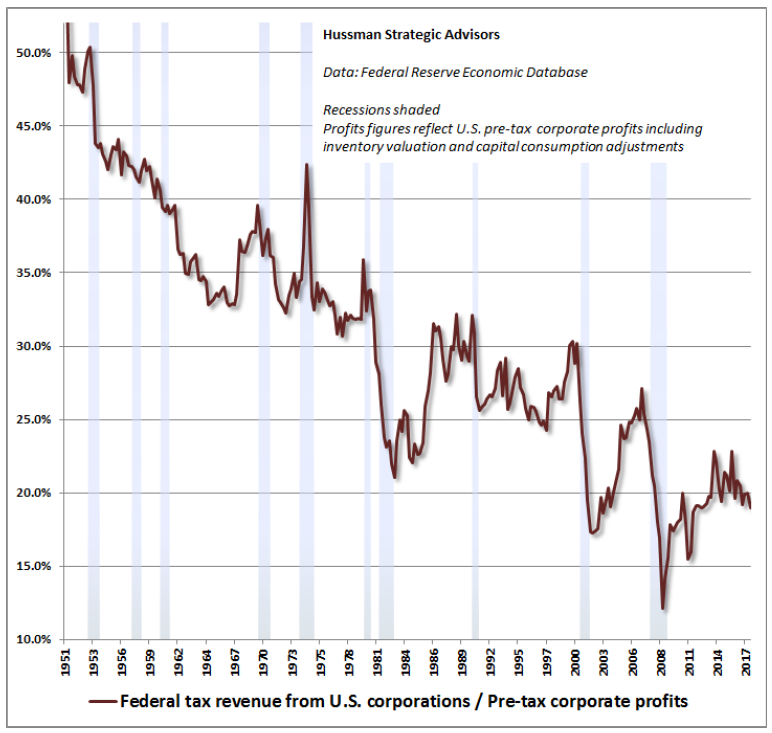
Coincidentally, the new tax rate bandied about is 20%, pretty much dead-on with the effective rate actually paid after all of the machinations big companies do like inversions and off-shore parking of earnings. Accordingly, it’s possible that there might be some disappointment about how much tax-reform benefits the S&P 500 overall. Unquestionably, though, there are certain companies and sectors that would see a steep cut in their tax bills (in a nod to our long-disliked small cap stocks, they are seen as bigger beneficiaries, which has always struck me as a bit strange since almost one-third of them lose money!).
There are those who are salivating over the repatriation of some $2.6 trillion that the big publicly-traded US companies are holding offshore. Yet, as the Wall Street Journal reported this week, the majority of this stash may already be in US securities, mostly treasury debt. It just hasn’t been taxed yet and the new rate for moving it from one account to the other might be a relatively painless 14%. If so, that’s likely to be viewed constructively—at least for a handful of large cap US tech companies (mostly those mentioned above).
However, when a similar “tax holiday” occurred back in 2004, the repatriation rate was a mere 5%. Its impact on long-term economic growth is now generally viewed as modest.
It’s also acknowledging a reality that this tax-bill has been used as a reason to rally stocks multiple times since Mr. Trump was elected. The market never goes down much when it hits a snag and then ratchets up again once the political tides shift in favor of passage. However, it’s certainly possible we could be in store for more of this blissfully one-sided scenario.
Leopards can’t change their spots but maybe birds can change their feathers. Wouldn’t it be ironic if the stock market’s best friends—the leading central banks—spoiled all the fun? If you’ve been reading the various utterances from the Fed, as it prepares to hand the baton from Ms. Yellen to Mr. Powell, you can’t help but notice the tone-shift. The former cooing doves are making noises that sound a lot more like screeching hawks these days. And it’s not only the Fed.
Even the poster-child for from-here-to-QEternity, the Bank of Japan, is also sending out smoke signals about less money fabrication and—gasp—letting interest rates rise from essentially zero. Because the phenomenon of central bank digital printing presses running at warp speed has been so closely tied to the S&P 500’s relentless rise, we think this sea change is being ignored in all the hoopla over tax reform.
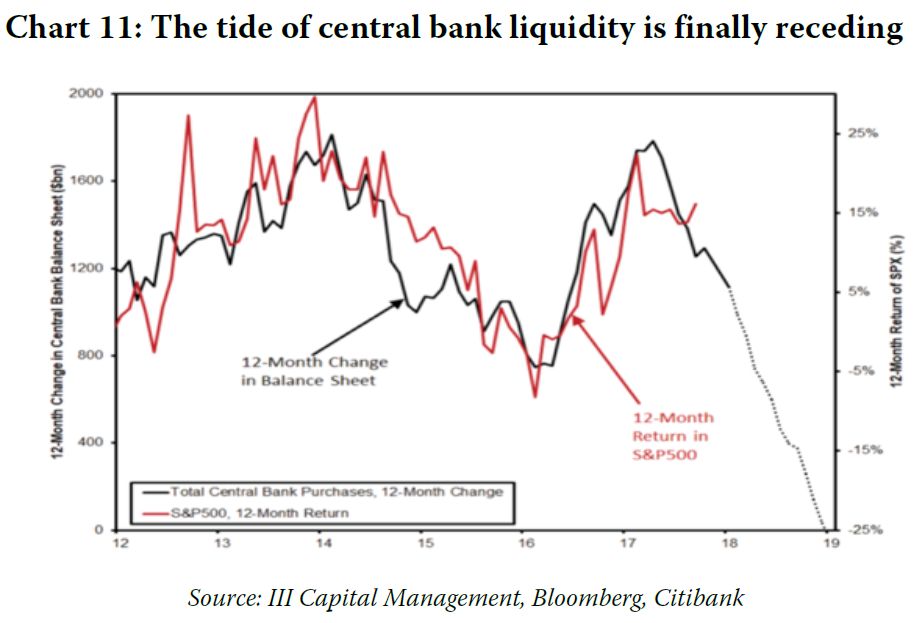
Certainly, there are those such as Gavekal’s illustrious Anatole Kaletsky, highlighted in our November 24th EVA, who believe it’s been economic growth that has powered the market in recent years. Once more on the other hand, there is the brainy Stephanie Pomboy who points out that in the last two years the market has risen by $8 trillion in value vs just a $1 trillion increase in US GDP. This 8:1 ratio has rarely happened in the past, mostly related to recessions when the economy has contracted—and that has clearly not been the case over the past 24 months. In the old days, before central banks went bonkers, there was a tight link between economic growth and stock prices. Who knows…someday, there may be again; stranger things have happened—particularly over the last five years.
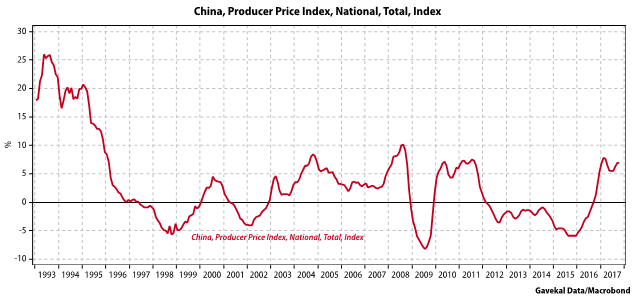
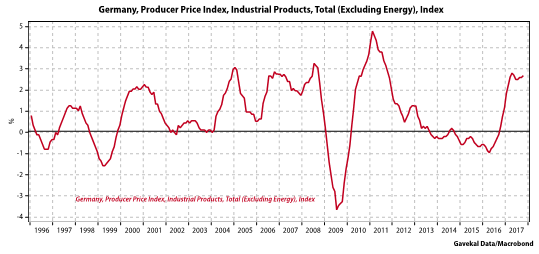
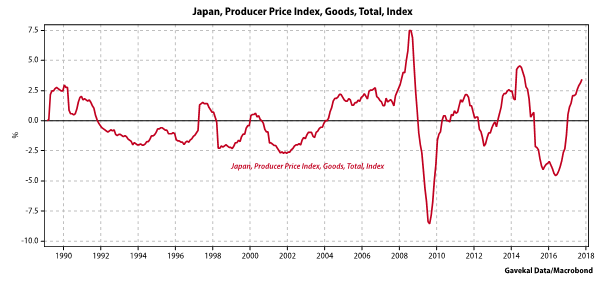
Another factor may soon be revving up the world’s most powerful central bank, a risk Evergreen hasn’t been worried about for a very long time: inflation. My partner Louis Gave, who some call the smartest man in Asia, is picking up the strong scent of inflation due to his crack research team and extensive global contacts. The latter include some of the biggest asset managers on the planet.
Producer Price Index (PPI) measures are certainly reflecting a much stronger inflationary impulse. As you can see in the below charts, this even includes Japan!
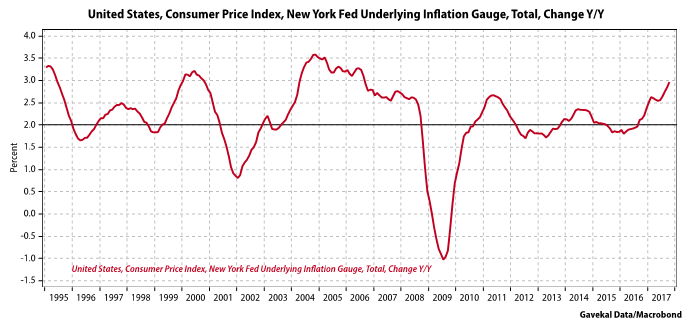
Moreover, as we noted in the Guest EVA “starring” Danielle DiMartino Booth (who definitely exudes star power), the Fed is using a new Consumer Price Index (CPI) measure, called the Underlying Inflation Gauge (UIG). Per that EVA, the UIG includes a component tracking asset price inflation. As we all know—or should—that is where price increases have been running rampant (including a recent alleged Da Vinci painting of Jesus Christ that sold for nearly half a billion dollars, three times the prior record!).
If an inflationary, budget-busting tax bill does get enacted, it will only embolden the Fed to tighten further and faster, particularly given the aforementioned upward wage pressure. The market presently doesn’t believe the Fed’s “dot plot” of three to four more hikes over the next year, but we do. In fact, unless the present Dom Perignon environment changes before that, we believe it may tighten even more than four times over the next 12 to 13 months.
Regardless, the yield curve (the difference between short and long interest rates) is likely to continue flattening or even inverting. However, we would provide one caveat in this regard: should inflation truly heat up, more extended bond yields might spike for a time. But “spike” is the operative word, as in a brief surge and then a plunge. We continue to be convinced that a world which has added $70 trillion of additional debt over the last 10 years has little ability to withstand a significant rise in interest rates—at least not for very long.

David Hay
Chief Investment Officer
To contact Dave, email:
dhay@evergreengavekal.com
OUR CURRENT LIKES AND DISLIKES
No changes this week.
LIKE
NEUTRAL
DISLIKE
DISCLOSURE: This material has been prepared or is distributed solely for informational purposes only and is not a solicitation or an offer to buy any security or instrument or to participate in any trading strategy. Any opinions, recommendations, and assumptions included in this presentation are based upon current market conditions, reflect our judgment as of the date of this presentation, and are subject to change. Past performance is no guarantee of future results. All investments involve risk including the loss of principal. All material presented is compiled from sources believed to be reliable, but accuracy cannot be guaranteed and Evergreen makes no representation as to its accuracy or completeness. Securities highlighted or discussed in this communication are mentioned for illustrative purposes only and are not a recommendation for these securities. Evergreen actively manages client portfolios and securities discussed in this communication may or may not be held in such portfolios at any given time.