
“Buy when everyone else is selling and hold until everyone else is buying. That’s not just a catchy slogan. It’s the very essence of successful investing.”
-J. PAUL GETTY
Over the last year, it has been a challenging environment for bond investors as interest rates continue to grind higher. Inflation readings registering multi-year highs are certainly one factor causing higher borrowing costs. However, perhaps the biggest influence on higher rates is the shifting supply and demand dynamic from fiscal and monetary policy changes. On the fiscal side, the tax overhaul, along with increased military and domestic spending, is expected to significantly widen our budget deficit, which means a surge in treasury borrowing. In fact, US treasury issuance is expected to double to $1.3 trillion this year.
This is occurring at the same time the Fed is embarking on its major unwind of QE (quantitative easing). So, at the same time Treasury issuance is set to surge, the Fed, a multi-trillion dollar buyer of US government debt over recent years, is now in liquidation mode. In the near future, the Fed will be selling at roughly a $500 billion annualized rate.
This supply surge, combined with seven fed funds rate hikes, has caused income investments to post broadly negative returns over the last year, as you can see in the chart below. The worst performer of the bunch has been emerging market (EM) local currency debt, which is down 15% over this timeframe.
INCOME PERFORMANCE BY ASSET CLASS (SEPTEMBER 2017 – PRESENT)
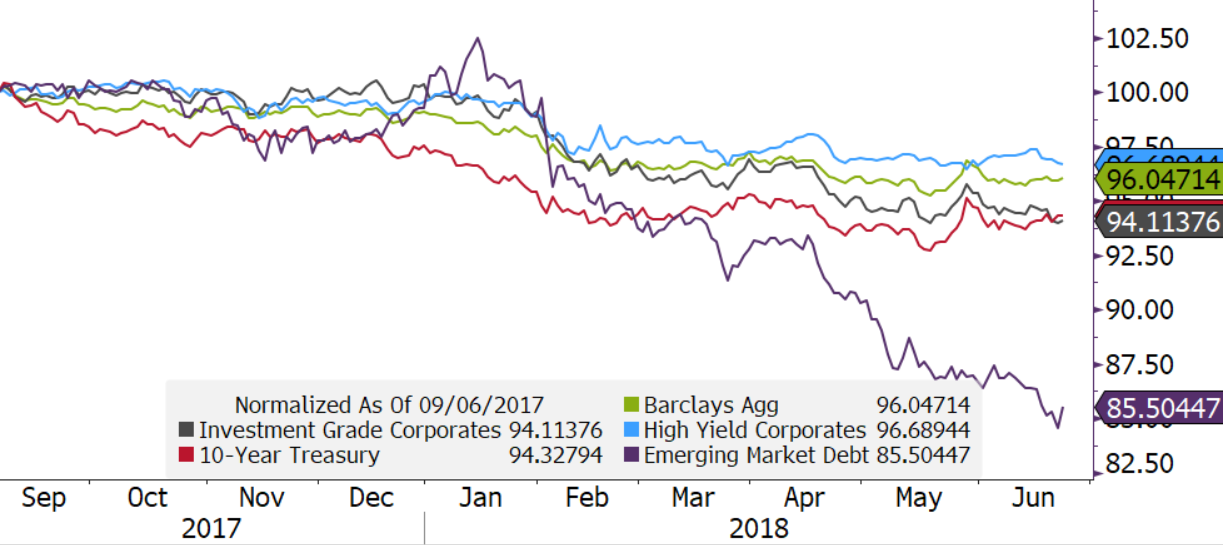 Source: Evergreen Gavekal. Data as of June 25, 2018.
There are several influences at play within the emerging market debt space that have led to this underperformance. Higher interest rates in developed economies, like the US, certainly tend to translate into higher yields for EM bonds. In addition to global interest rates, currency fluctuations and credit spreads also impact prices. The latter is simply the difference between the borrowing costs of a developing economy verses US treasuries. As we previously mentioned, global interest rates have been on the rise for some time, but more recently EM currencies have plunged and credit spreads have begun to widen, as shown in the following chart.
10-YEAR TREASURY YIELD (GREEN), EM CREDIT SPREAD
(GREY), AND EM CURRENCY INDEX (BLUE)
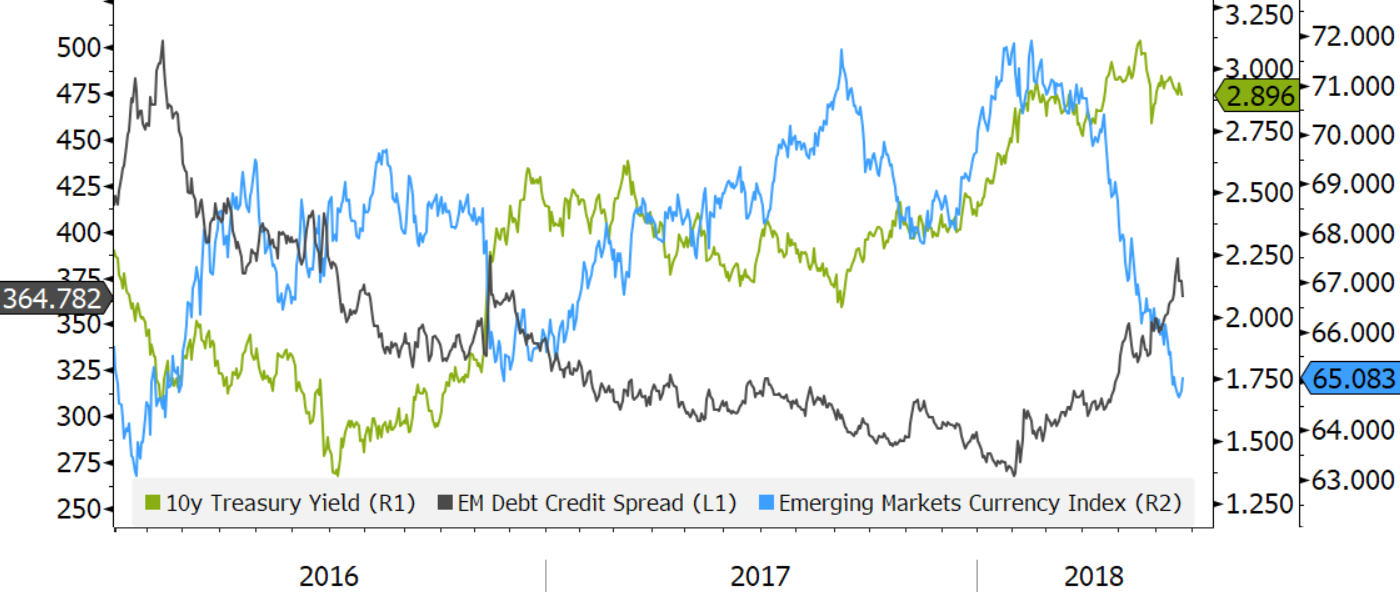 Source: Evergreen Gavekal. Data as of June 25, 2018.
For an individual country’s government bond, this means deeply negative returns. If we take Brazil’s 10-year bond as an example, the price in US dollars is down 24% over the last three months. The bond’s yield over the same time has moved up from around 9.5% to over 12%. These periods of underperformance tend to be good opportunities to trade into EM debt.
BRAZIL 10-YEAR BOND PRICE VS. YIELD
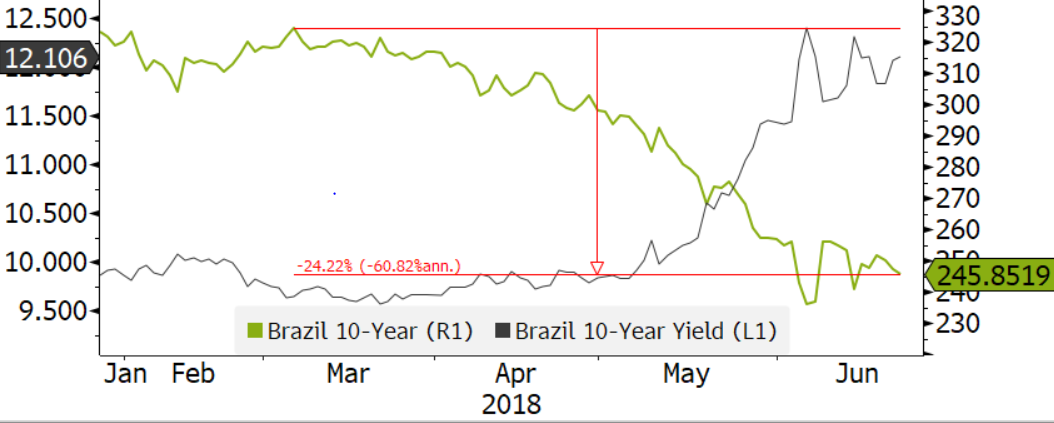 Source: Evergreen Gavekal. Data as of June 25, 2018.
One metric for judging a decent entry point into EM bonds is their performance relative to US high yield (aka, junk) corporate debt. When there is severe underperformance between the two, it’s worth considering adding to the underperforming asset class. The chart below shows a high yield index and an emerging market index, along with the relative performance between the two. The lower pane shows that over the last 3-months, emerging market bonds have unperformed US high yield bonds by 13%. This is near a low over the last 7-years, which means the investments tend to mean revert, or outperform, after these periods. In fact, if we look back to 2008, there were only 173 days when the underperformance gap exceeded 10%. The forward average one-year return for emerging market bonds for these samples averaged 15%. Additionally, over 80% of these data points exhibited positive returns.
EMERGING MARKET BOND INDEX, HIGH YIELD INDEX,
AND RELATIVE 3-MONTH PERFORMANCE
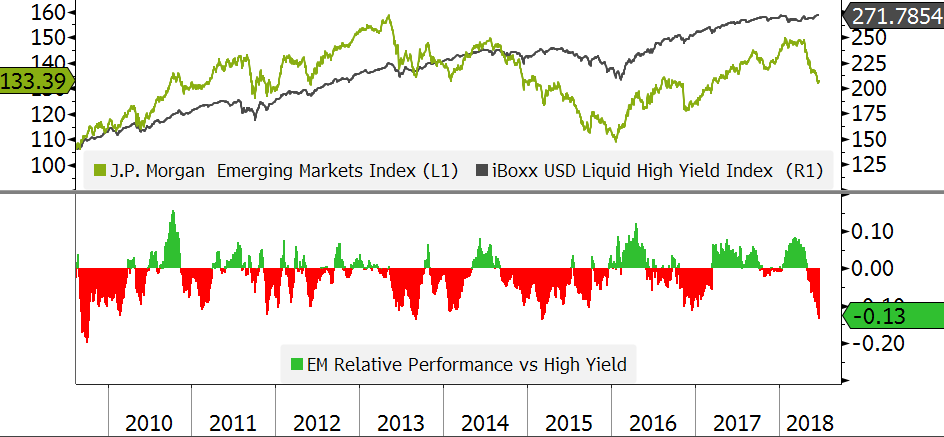 Source: Evergreen Gavekal. Data as of June 25, 2018.
Sentiment on an asset class is also something to consider. As we have highlighted in numerous EVAs, sentiment tends to be a contrarian indicator. When you get pervasive bearishness, it tends to be an advantageous time to add to a market or asset class. Conversely, excessive bullishness in an area should cause at least a revaluation, if not a reduction, of exposure in that area. During this recent bout of underperformance for emerging markets, there have been massive outflows from EM equity mutual funds and ETFs. The chart below highlights that the largest emerging market ETF has experienced almost $8bn of outflows over the last six months. (Even though this relates to EM stock markets, it is nevertheless indicative of the intense negative sentiment toward most developing market securities presently.) Another interesting and relevant factoid is that the Shanghai Composite Index (a main Index in China) has dropped 25% since late-January. Yet another sign that sentiment has turned bearish in short order.
EMERGING EQUITY MARKET ETF TRAILING 6-MONTH FUND FLOWS
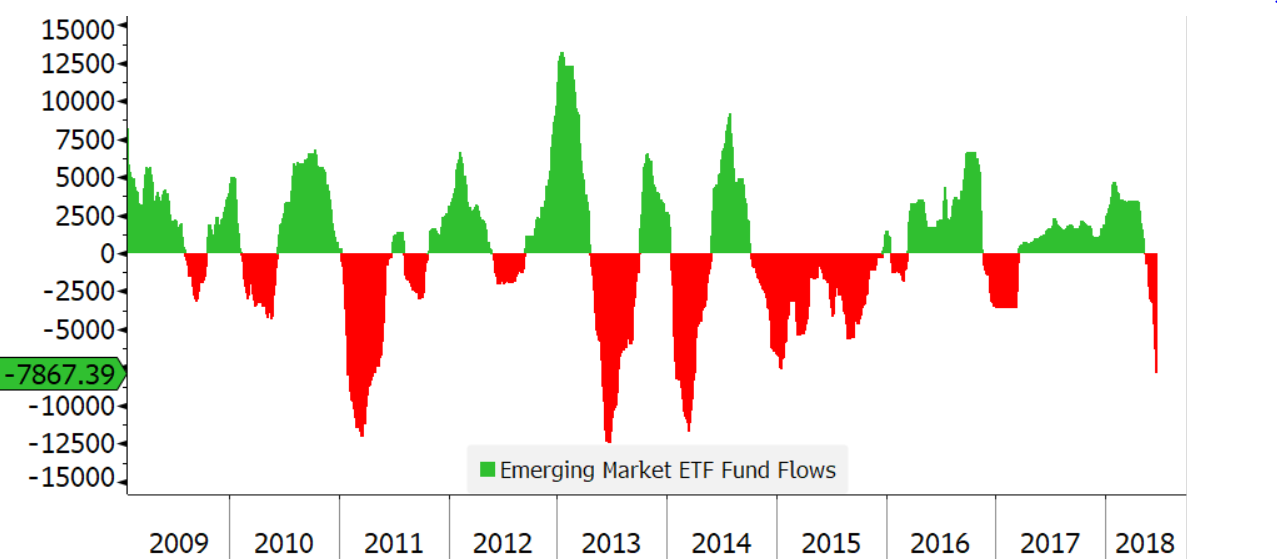 Source: Evergreen Gavekal. Data as of June 25, 2018.
The absolute level of yields is also a key piece of information when analyzing an income investment. As you can see in the chart below, the yield on the emerging market bond index is at a critical resistance level of 6.5%. This is also approaching an eight-year high for the yield in the space, which means investors are being paid more today than at any time in almost a decade. It’s also worth highlighting the yield fell to as low as 3.75% in 2012. If you had invested into the EM space at the yield low, the total return over the last 5-years would have been -16%. Conversely, the last time we approached this 6.5% level was in early 2016, after which a powerful rally ensued. Yields quickly compressed from 6.5% to 5%, which worked out to a healthy 20% total return in a relatively short timeframe. That’s nearly 7 years of income based on today’s 10-year treasury yield! At Evergreen, we did buy into EM debt during 2016 and then sold out of this exposure in late 2017.
EMERGING MARKET DEBT INDEX YIELD
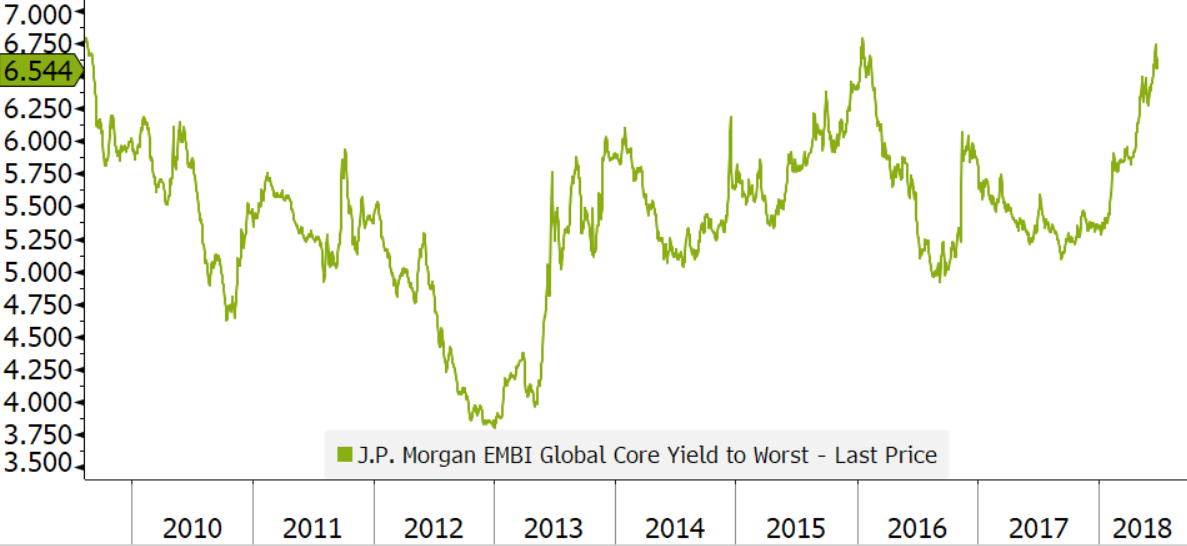 Source: Evergreen Gavekal. Data as of June 25, 2018.
After holding limited EM debt exposure over the last year, we are now recommending investors begin to accumulate this asset class for income portfolios. This is due to sentiment moving bearish, valuations becoming attractive, and significant underperformance. However, the recent trade war rhetoric out of Washington, as well as the retaliatory responses from countries like China, appears to be getting worse. Thus, we believe it makes sense to start with a small position and be willing to add on further weakness.
That said, we believe with EM currencies down and yields up as much as they are, buying today will provide a solid total return over the next few years. If the space does deteriorate further, we would recommend continuing to add to this area. In our view, developing market bonds offer one of the highest return potentials within the global fixed-income market. To go even further out on the limb, we believe they are also likely to provide much higher future returns than the still priced-for-perfection (and then some) US stock market. Unquestionably, this is a very against-the-grain outlook but history has repeatedly shown that’s when the best returns are produced.

Jeff Dicks, CFA
Director of Portfolios
To contact Jeff, email:
jdicks@evergreengavekal.com
OUR CURRENT LIKES AND DISLIKES
Changes highlighted in bold.
LIKE
NEUTRAL
DISLIKE
* Credit spreads are the difference between non-government bond interest rates and treasury yields.
** Due to recent weakness, certain BB issues look attractive.
DISCLOSURE: This material has been prepared or is distributed solely for informational purposes only and is not a solicitation or an offer to buy any security or instrument or to participate in any trading strategy. Any opinions, recommendations, and assumptions included in this presentation are based upon current market conditions, reflect our judgment as of the date of this presentation, and are subject to change. Past performance is no guarantee of future results. All investments involve risk including the loss of principal. All material presented is compiled from sources believed to be reliable, but accuracy cannot be guaranteed and Evergreen makes no representation as to its accuracy or completeness. Securities highlighted or discussed in this communication are mentioned for illustrative purposes only and are not a recommendation for these securities. Evergreen actively manages client portfolios and securities discussed in this communication may or may not be held in such portfolios at any given time.