It was Senator Everett Dirksen, a Senate minority leader in the 1960s, who, speaking of federal government spending, famously quipped, “A billion here and a billion there and pretty soon we’re talking about real money.” Of course, today this almost seems quaint. Rookie numbers, really.
After all, when it comes to big numbers, this is what markets will have to digest over the coming weeks, months and quarters.
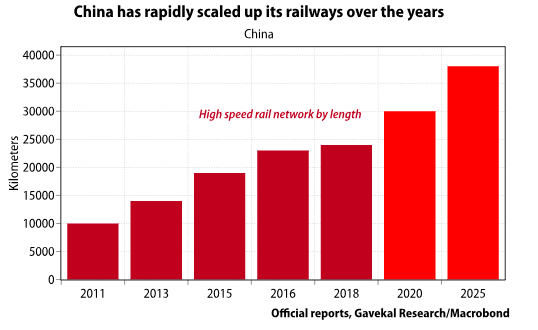
Staying with the white elephant theme, between 2014 and 2018, when China’s construction boom was really going gangbusters, it is estimated that China spent roughly RMB100trn (US$14trn) on construction of all kinds. This construction boom allowed roughly 800mn people to move out of insalubrious housing and into the modern world…
The AI data center spending boom is thus estimated to be roughly half the size of the Chinese construction boom over a similar period. And this for assets that have a far faster depreciation cycle and are more prone to obsolescence than apartment buildings. The buildings that China built 10 years ago are still there and mostly still occupied. Meanwhile, will the data centers built in 2026 still be useful in 2036?
Perhaps a more apt comparison is that between 1996 and 2000, US telecom companies spent roughly US$500bn on internet and broadband infrastructure, or US$930bn in inflation-adjusted terms. Today’s AI capex boom is thus roughly equal to 7x the internet capex boom.
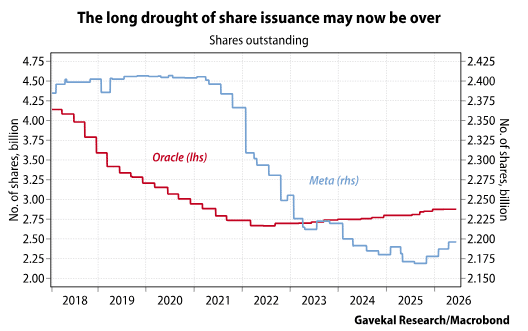
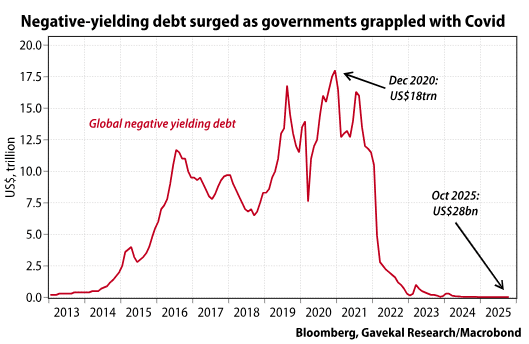
On this front, 2026 should break records. Until now, the biggest year on record for equity capital raised was 2021, when issuers around the world (including frivolous special-purpose acquisition companies) raised some US$300bn in equity capital. Of course, back then more than US$10trn of OECD debt was trading at negative yields, central bank balance sheets were blowing out and fiscal authorities in many countries were sending checks to everyone through the mail. In short, the liquidity environment was plentiful. Today, against a very different backdrop, five companies—Alphabet, Meta, SpaceX, Anthropic and OpenAI—are proposing to raise essentially as much, in the space of a few weeks, on the US equity market alone. This is unprecedented.
In short, the demand for cash is set to be enormous for the foreseeable future. Leaving us pondering the age-old question of where the money will come from.
I have probably relayed this anecdote too many times over the years, but when I first started in this business, one of our very first clients, Beat Notz of Notz Stucki told me: “It’s an easy business. You just need to figure out if there is more money than fools, in which case you buy stocks, or more fools than money, in which case you don’t.”
In the coming weeks, months and quarters, the demand for money is going to be simply gargantuan, especially if the Strait of Hormuz duly reopens. Indeed, to the extent that its closure led everyone to run down inventories, the war in Iran, at least in the short term, turned out to be a liquidity-positive event for markets. Unfortunately, this massive increase in the demand for money is set to occur at a time when the ratio of “money to fools” is, at least in the US, standing at all-time highs.
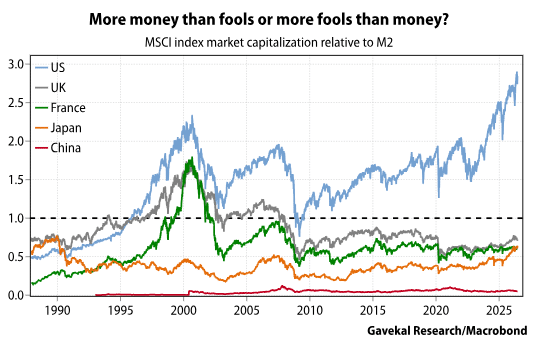
In that chart, most investors will be aware of the “Warren Buffett indicator,” which compares market capitalization to GDP. The above chart is broadly similar, except that GDP is replaced by broad money (M2). The idea is that, for a market to push higher, it usually needs more money.
This latter point is what made the US market somewhat unique in recent years. The new type of companies no longer needed capital. Companies focused on design and sales, and then outsourced the manufacturing/capital-intensive part of the production process to other parts of the world (the “we think, they sweat” mantra). Numerous companies thus ended up with very capital-light business models, and the ability to reinvest cash flows into share buybacks. This allowed the above “money-to-fools” ratio to leave the 1999-2000 levels in the dust.
Now suddenly in an odd twist of fate, Western companies and investors seem keen to abandon the “we think” mantra. Instead, it seems that the new mantra is “we spend dollops of dollars on AI data centers so that we do not have to think and they sweat”. Granted, this does not seem quite as catchy as a mantra. Nor should it be that enticing for investors? But either way, the equation is now changing. Instead of injecting liquidity back into the market through buybacks, the likes of Alphabet, Meta and others will now be draining the market with share issuances of unprecedented size (when Google went public in 2004, it raised US$1.7bn; Alphabet just issued US$85bn of stock).
All of which should leave investors pondering the question of where the money will come from.
As mentioned above, back in 2021, the previous record year for IPOs, governments across the OECD were busy mailing checks so everyone would stay at home and watch Netflix. Energy prices were low and monetary aggregates around the world were soaring as central banks monetized increases in government debt. More than US$10trn of government debt globally was priced to offer negative yields to investors.
Fast forward to today and the environment could not be more different. After all, as we write:
In short, the demand for capital is going through the roof, while its supply seems ever more constrained. Unsurprisingly, the price of capital is going up. So who stands to benefit? On paper, this setup should be promising for banks.
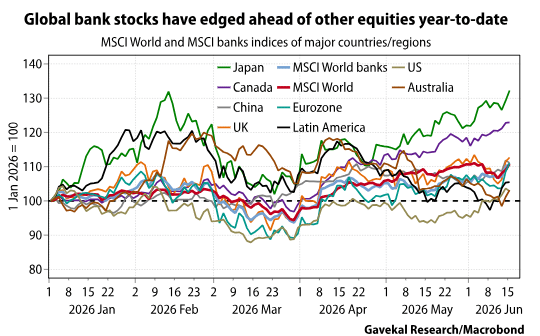
Interestingly, for the first time this year, banks, as measured by the MSCI World banks index shown on the chart below (thick blue line) have started to outperform, albeit barely, the global benchmark MSCI World index (thick red line).
Though as always when it comes to banks, the dispersion in performance has been quite acute. Indeed, so far this year we have witnessed:
Which brings us to our last point: the global liquidity environment is undeniably changing rapidly before our eyes. This should benefit the banks in Japan, the eurozone and China that have built large depositor bases and should now find themselves able to transform those funding networks into loans earning higher returns. The flip side is that anyone running a highly leveraged business model will find themselves paying more for capital, more for chips, more for electricity and more for gasoline. And banks that rely on wholesale funding markets should also struggle.
DISCLOSURE: This material has been prepared or is distributed solely for informational purposes only and is not a solicitation or an offer to buy any security or instrument or to participate in any trading strategy. Any opinions, recommendations, and assumptions included in this presentation are based upon current market conditions, reflect our judgment as of the date of this presentation, and are subject to change. Past performance is no guarantee of future results. All investments involve risk including the loss of principal. All material presented is compiled from sources believed to be reliable, but accuracy cannot be guaranteed and Evergreen makes no representation as to its accuracy or completeness. Securities highlighted or discussed in this communication are mentioned for illustrative purposes only and are not a recommendation for these securities. Evergreen actively manages client portfolios and securities discussed in this communication may or may not be held in such portfolios at any given time.
